Evidence that the Delta wave may be peaking in the earliest hit States
Coronavirus dashboard for August 11: evidence that the Delta wave may be peaking in the earliest hit States
My framework of analyzing the economy via leading, coincident, and lagging indicators continues to come in handy at looking at the course of the pandemic.
At the beginning of June, I flagged that the number of cases had stopped declining among 5 of the least vaccinated States. By the middle of June, I wrote that Delta was going to be a real challenge for those States. More pointedly, on June 23, I wrote that the Delta wave was beginning in those States, including Missouri, Arkansas, Nevada, Oklahoma, and Utah. Sure enough, as the days went by, more and more States showed increasing cases as Delta took hold. By the end of June, I was warning that the end of July was going to look very different, and by late in July I was warning that the US was on track for 1000 deaths/day by the end of August (as of this morning, deaths are up to 545).
Consistent with the idea that Delta has been burning through the dry tinder, as demonstrated by the sharp peaks and declines in India and the UK, I have been looking for signs of when the peak might come in those early States hit with Delta. And the signs now look like they are showing up.
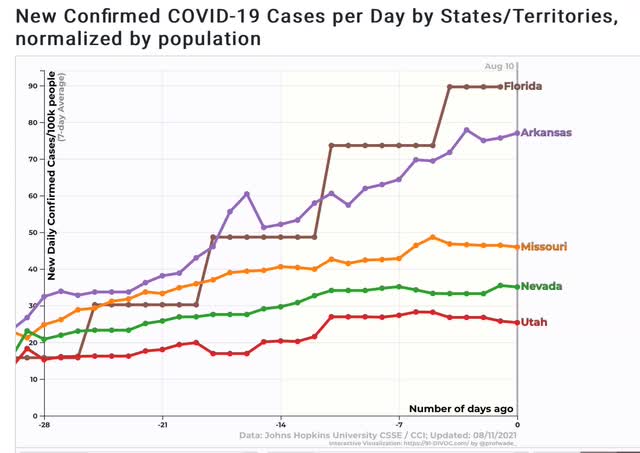
Here are the 7-day averages in new cases in 4 of the earliest hit States – Missouri, Arkansas, Nevada, and Utah, plus Florida as well. In 3 of the States – Missouri, Nevada, and Utah – new cases look completely flat over the past 7 to 10 days. In the other two, the rate of growth appears to be decelerating:
The ratio of positive to total COVID tests in 4 of those also appears to have peaked (Florida no longer bothers to report):
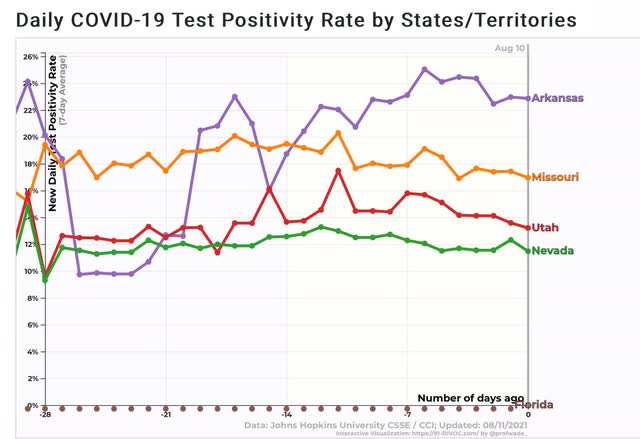
This is pretty strong evidence that the Delta wave is peaking in those States.
Turning our attention further to the ratio of positive to total tests, here is a graph of the 10 States with the highest ratio, in addition to the 5 already examined:
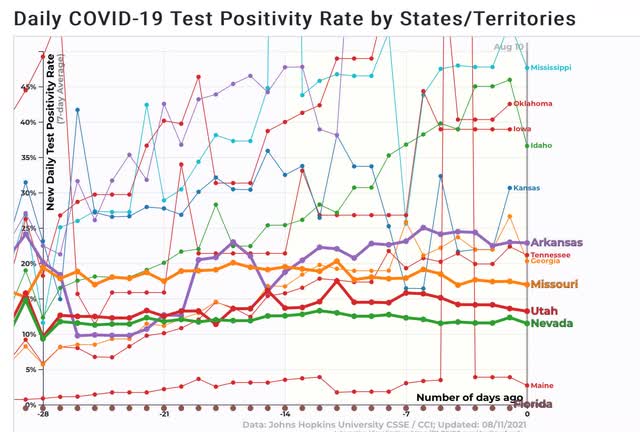
We have 5 States over 30% – Mississippi, Oklahoma, Iowa, Idaho, and Kansas.
Let’s compare this to the signal case of South Dakota:
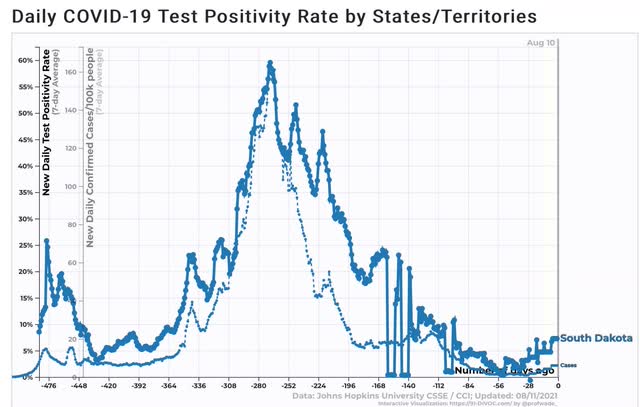
South Dakota’s positivity ratio peaked at 60% during its horrific outbreak last autumn. Right now South Dakota is averaging 6 cases per 100,000 per day, the lowest of any State in the nation.
As I have speculated a number of times, South Dakota may have stumbled into herd immunity, or at least close to it, the hard way. The positivity rates in the worst-hit States for Delta suggest that some of them at least, may not be far behind.
Once Delta burns through the dry tinder nationwide, which is looking more and more to happen sometime around Labor Day, just what % of all Americans have actually been infected by COVID becomes determinative in what is likely to happen next.
Rhode Island and North Dakota have both had more cases per million pop than South Dakota…but i don’t see that much difference in the infection rates of the top six in that category (inc AR, TN, & UT) to make a difference; they’re all around 14%
Is it herd immunity or people starting to be more cautious again? We and our friends have been canceling travel and being more cautious about restaurants now that we’re seeing a lot more COVID cases. We are vaccinated, but we started masking up indoors just a few weeks after the state dropped its indoor mask mandate for the vaccinated.
We’ve seen COVID cases go up and down. Up when more people decide to get together and attend indoor events, and down when people start wearing masks, avoiding indoor events and taking other precautions. We were nowhere near herd immunity when the case count went down last year, and, since natural immunity only lasts for so many months, the supply of “tinder” replenishes.
I suppose that natural immunity decreases over time, but what is the mild or asymptotic prior “infectee” going to think about that? Start out by observing they clearly survived, the big majority were not hospitalized and probable huge numbers of them simply waited out the 10 days or whatever they got told. I suspect their buy-in to serious behavior changes won’t be too high.
Kaleberg,
Which state?