April Trade Deficit Decreased 8.2% on Lower Imports
April Trade Deficit Decreased 8.2% on Lower Imports of Consumer Goods and Automotives, Commenter and blogger RJS
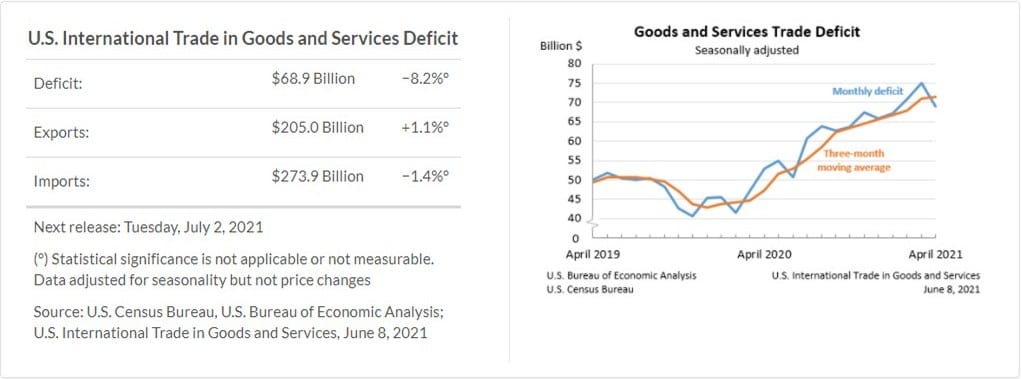
Our trade deficit was 8.2% lower in April, as our exports increased and our imports decreased . . . the Commerce Dept report on our international trade in goods and services for April, incorporating an annual revision, indicated that our seasonally adjusted goods and services trade deficit fell by a rounded $6.1 billion to $68.9 billion in April, from a March deficit that was revised from the originally reported $74.4 billion to $75.0 billion, a revision which should result in an downward revision of about 0.10 percentage points to 1st quarter GDP when the third estimate is released at the end of June; however, this month’s report also reflects revised statistics on trade in goods on both a Census basis and a balance of payments (BOP) basis going back to 2016, and revised statistics on trade in services beginning with 2013, so the 4th quarter basis for the 1st quarter’s growth in trade will also need to be revised to determine the ultimate impact on 1st quarter GDP, and the BEA will not make that revision till the annual revision to GDP is released at the end of July . . .
In rounded figures, the value of our April exports rose by $2.3 billion, or 1.1%, to $205.0 billion, on a $1.6 billion increase to $145.3 billion in our exports of goods and a $0.7 billion increase to $59.7 billion in our exports of services, while our imports fell by $3.8 billion, or 1.4% to $273.9 billion on a $4.5 billion decrease to $232.0 billion in our imports of goods, which was partly offset a $0.7 billion increase to $41.9 billion in our imports of services…export prices averaged 0.8% higher in April, which means the change in our real exports was less than than the nominal increase by roughly that percentage, while import prices were 0.7% higher, meaning that our real imports were likewise smaller than than their nominal value by that percentage . . .
The increase in our April exports of goods came about largely as a result of higher exports of capital goods and of industrial supplies and materials, which were partly offset by lower exports of automotive goods…referencing the Full Release and Tables for April (pdf), in Exhibit 7 we find that our exports of capital goods rose by $2,074 million to $44,250 million on a $1,425 million increase in our exports of civilian aircraft and a $305 million increase in our exports of semiconductors, and that our exports of industrial supplies and materials rose by $831 million to $52,200 million on a $981 million increase in our exports of crude oil, a $518 million increase in our exports of fuel oil, a $623 million increase in our exports of petroleum products other than fuel oil, and a $344 million increase in our exports of organic chemicals, which were partly offset by a $1313 million decrease in our exports of non monetary gold and a $328 million decrease in our exports of other precious metals…in addition, our exports of foods, feeds and beverages rose by $268 million to $13,798 million on increases exports of several food items, despite lower exports of corn, soybeans, and other animal feeds…partly offsetting the increases in those export categories, our exports of automotive vehicles, parts, and engines fell by $1,027 million to $11,916 million on a $411 million decrease in our exports of parts and accessories of vehicles other than engines, chassis, and tires and a $398 million decrease in our exports of trucks, buses, and special purpose vehicles, our exports of consumer goods fell by $252 million to $16,976 million on a $243 million decrease in our exports of cell phones, and our exports of other goods not categorized by end use fell by $260 million to $5,633 million….
Exhibit 8 in the Full Release and Tables gives us seasonally adjusted details on our goods imports and indicates that lower imports of consumer goods and of automotive goods were largely responsible for the April decrease in our imports….our imports of consumer goods fell by $2,612 million to $63,719 million on a a $890 million decrease in our imports of apparel and textiles other than those of wool or cotton, a $692 million decrease in our imports of toys, games, and sporting goods, a $682 million decrease in our imports of household appliances, a $616 million decrease in our imports of cotton apparel and household goods, a $565 million decrease in our imports of stereo equipment and related goods, a $393 million decrease in our imports of footwear, a $351 million decrease in our imports of art, antiques, and other collectibles, and a $324 million decrease in our imports of non-textile apparel and household goods, which were partly offset by a $1,689 million increase in our imports of cell phones and similar household goods and a $308 million increase in our imports of pharmaceuticals…at the same time, our imports of automotive vehicles, parts and engines fell by $1,056 million to $29,361 million on a $695 million decrease in our imports of parts and accessories of vehicles other than engines, chassis, and tires and a $478 million decrease in our imports of new and used passenger cars, while our imports of industrial supplies and materials fell by $814 million to $49,695 million on a $504 million decrease in our imports of fuel oil, and our imports of other goods not categorized by end use fell by $819 million to $9,475 million….partly offsetting those increases, our imports of foods, feeds, and beverages rose by $473 million to $14,546 million on a $229 increase in our imports of fish and shellfish, our imports of capital goods rose by $272 million to $63,705 million on a $382 million increase in our imports of civilian aircraft and increases in imports of other capital goods, offset by a $749 million decrease in our imports of semiconductors and a $544 million decrease in our imports of computers…
The Full Release and Tables pdf for this report also gives us surplus and deficit details on our goods trade with selected countries:
The April figures show surpluses, in billions of dollars, with South and Central America ($3.5), Hong Kong ($3.0), Brazil ($1.1), Singapore ($0.8), United Kingdom ($0.6), and Saudi Arabia ($0.3). Deficits were recorded, in billions of dollars, with China ($32.4), European Union ($16.1), Mexico ($10.0), Japan ($5.4), Germany ($5.1), Taiwan ($3.2), Canada ($3.0), Italy ($2.9), India ($2.6), France ($1.9), and South Korea ($1.2).
- The deficit with China decreased $7.1 billion to $32.4 billion in April. Exports increased $1.0 billion to $13.1 billion and imports decreased $6.0 billion to $45.5 billion.
- The deficit with the European Union decreased $1.0 billion to $16.1 billion in April. Exports increased $2.0 billion to $22.2 billion and imports increased $1.0 billion to $38.3 billion.
- The deficit with Mexico increased $1.2 billion to $10.0 billion in April. Exports increased less than $0.1 billion to $22.5 billion and imports increased $1.3 billion to $32.4 billion.
To gauge the impact of April’s trade on 2nd quarter growth, we use exhibit 10 in the pdf for this report, which gives us monthly goods trade figures by end use category and in total, already adjusted for inflation in chained 2012 dollars, the same inflation adjustment that’s used by the BEA to compute trade figures for GDP, with the only difference being that they are not annualized in the table here…from that table, we can figure that 1st quarter real exports of goods averaged 143,737.3 million monthly in 2012 dollars, while April’s inflation adjusted exports were at 148,458 million in that same 2012 dollar quantity index representation… figuring the annualized change between those two figures, we find that April’s real exports of goods were rising at a 13.80% annual rate from those of the 1st quarter, or at a pace that would add about 0.85 percentage points to 2nd quarter GDP if it were continued through May and June…..from that same table, we can figure that our 1st quarter real imports averaged 245,402.6 million monthly in chained 2012 dollars, while inflation adjusted April imports were at 247,050 million in that same 2012 dollar representation . . . that would indicate that so far in the 2nd quarter, our real imports have increased at a 2.71% annual rate from those of the 1st quarter…since imports are subtracted from GDP because they represent the portion of consumption or investment that occurred during the quarter that was not produced domestically, their increase at a 2.71% rate would subtract about 0.28 percentage points from 2nd quarter GDP….hence, if the April trade deficit is maintained at the same level throughout the 2nd quarter, our improving balance of trade in goods would add about 0.57 percentage points to the growth of 2nd quarter GDP….however, note that we have not estimated the impact of the change in services here, largely because the Census does not provide handy inflation adjusted data on those, but that with our nominal exports and imports of services both up by $0.7 billion in April, we can figure that the change in our balance of trade in services would likely have a negligible impact on 2nd quarter GDP…
Although most people are familiar with the problems in the global supply chain to some extent, some Starbucks customers are still shocked — even incensed — by their inability to get their coffee exactly how they want it. Others laugh it off.
“I was told they couldn’t give me an extra shot of caramel because there was a national shortage,” Nicole Brashear, a 24-year-old pharmacy student at the University of Louisiana at Monroe, said of ordering an iced caramel macchiato with extra caramel drizzle in late May. “I just sort of laughed and was like, ‘Isn’t caramel just burnt sugar?’”
The problem for Starbucks is that it was never just selling a simple cup of coffee. For many, the experience of visiting the chain is a self-indulgent treat.
Customers learn the language regarding sizes and special drinks and then share their customized, 12-ingredient drink orders on social media. Many look forward to seasonal specials, like this summer’s Unicorn Cake Pop and Strawberry Funnel Cake Frappuccino, which are available for a limited time.