April’s consumer and producer prices, etc.
April’s consumer and producer prices, retail sales, and industrial production; March business inventories and JOLTS, Commenter RJS, Market Watch 666
Retail Sales Unchanged in April after Big Revisions to Prior Months’ Sales
Seasonally adjusted retail sales were statistically unchanged in April, after retail sales March were revised higher, while sales for February were revised much lower. The Advance Retail Sales Report for April (pdf) from the Census Bureau estimated that our seasonally adjusted retail and food services sales totaled $619.9 billion for the month, which was virtually unchanged (±0.5 percent)* from revised March sales of $619.8 billion, but 51.2 percent (± 0.7 percent) above the adjusted sales of April of last year.
March sales were originally reported at $619.1 billion, up 9.8% from February; they are now indicated to have risen 10.7% to $619.8 billion because February adjusted sales were concurrently revised from $563.7 billion to $559.97 billion. The net of those revisions to February and March sales would reduce first quarter sales by about a $12 billion annual rate and subtract about 0.24 percentage points, give or take, from 1st quarter GDP when the 2nd estimate is released at the end of the month . . .estimated unadjusted sales, extrapolated from surveys of a small sampling of retailers, indicated nominal dollar sales fell 2.1%, from $629,941 million in March to $616,697 million in April, while they were up 51.4% from the $407,227 million of sales in April a year ago….
We are again including below the table of monthly and yearly percentage changes in sales by business type, taken from the Census marts pdf
The first double column below gives us the seasonally adjusted percentage change in sales for each type of retail business type from March to April in the first column, and then the year over year percentage change for those businesses since last April in the 2nd column; the second pair of columns gives us the revision of last month’s March advance monthly estimates (now called “preliminary”) as revised in this report, likewise for each business type, with the February to March change under “Feb 2021 r (revised)” and the revised March 2020 to March 2021 percentage change in the last column shown. For your reference, our copy of the table of last month’s advance March estimates, before this report’s revision, is here….
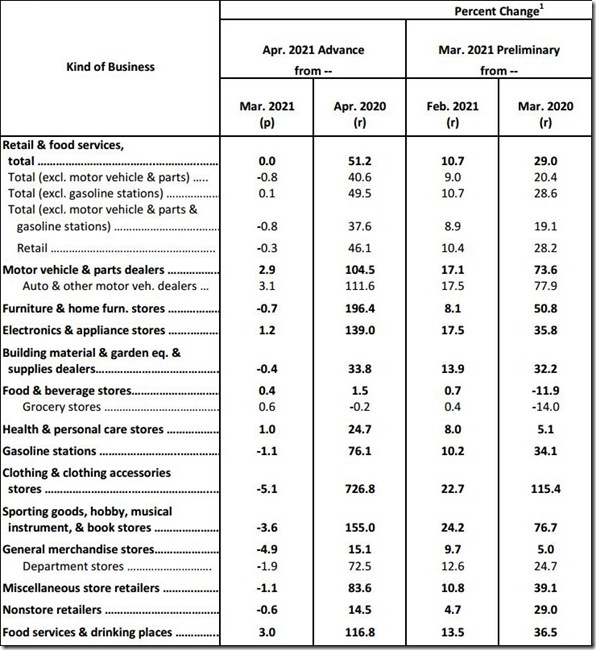
To compute April’s real personal consumption of goods data for national accounts from this April retail sales report, the BEA will use the corresponding price changes from the April consumer price index, which we reviewed above…to estimate what they will find, we’ll first separate out the volatile sales of gasoline from the other totals…from the third line on the above table, we can see that March retail sales excluding the 1.1% price-related decrease in sales at gas stations were up by 0.1%….then, by subtracting the amounts representing the 0.4% increase in grocery & beverage sales and the 3.0% increase in food services sales out from that total, we find core retail sales were down by more than 0.3% for the month.
Since the April CPI report showed that the the composite price index of all goods less food and energy goods was 2.0% higher in April, we can thus figure that real retail sales excluding food and energy will show an decrease of more than 2.3%…however, the actual adjustment in national accounts for each of the types of sales shown above will vary by the change in the related price index. For instance, while nominal sales at motor vehicle & parts dealers were up 2.9%, the April price index for transportation commodities other than fuel was 4.3% higher, which would suggest that real unit sales at auto & parts dealers were probably on the order of 1.3% or 1.4% lower once price increases are taken into account… similarly, while nominal sales at clothing stores were 5.1% lower in April, the apparel price index was 0.3% higher, which means that real sales of clothing likely fell around 5.4%.
In addition to figuring those core real retail sales, to make an estimate of the change in real sales, we’ll need to adjust food and energy retail sales for their price changes separately, just as the BEA will.
The April CPI report showed that the food price index was 0.4% higher, as the price index for food purchased for use at home rose 0.4% while the index for food bought away from home was 0.3% higher…thus, while nominal sales at food and beverage stores were 0.2% higher, real sales of food and beverages would have 0.2% lower in light of the 0.4% higher prices…similarly, the 3.0% increase in nominal sales at bars and restaurants, once adjusted for 0.3% higher prices, suggests that real sales at bars and restaurants rose by around 2.7% during the month.
While sales at gas stations were down 1.1%, there was a 1.3% decrease in price of gasoline during the month, which would suggest that real sales of gasoline were up on the order of 0.2%, with a caveat that gasoline stations do sell more than gasoline, products which should not be adjusted with gasoline prices, so the actual increase in real sales at gas stations was likely a bit smaller . . . reweighing and averaging the real sales changes that we have thus estimated back together, and excluding food services, we can then estimate that the income and outlays report for April will show that real personal consumption of goods fell by around 1.9% in April, after rising by a revised 7.5% in March, but after falling by a revised 1.9% in February and rising by 3.1% in January…at the same time, the 2.7% increase in real sales at bars and restaurants should add about 0.3% to April’s real personal consumption of services.
Tomorrow Producer Data