Household debt and the pandemic
Household debt and the pandemic
This is something I used to pay a lot more attention to back around the time of the Great Recession. How stretched were American households in paying their monthly bills? The Federal Reserve publishes a quarterly update tracking this issue. Two of the metrics in that quarterly update are debt service payments and financial obligations, respectively, as percents of household disposable income. The last update was in December, for Q3 2020. The Q4 figure should be released later this month.
And the story is how strong of an impact the pandemic stimulus has made on household balance sheets. Here’s the graph, that pretty much speaks for itself: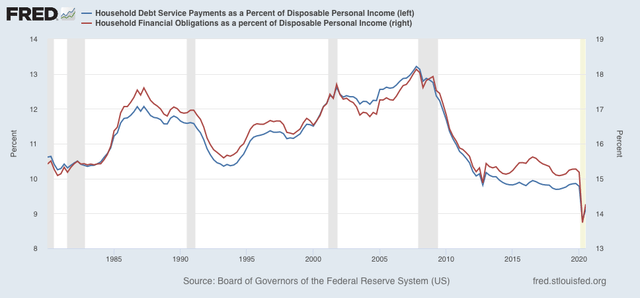
Both measures were by far at all-time lows in Q2, and increased slightly in Q3.
One important criticism is that these aren’t median measures. They tell us how the average, not median, household is doing, so they are subject to being skewed by high upper incomes. But the stimulus payments were not matched to income – e..g, every household got a $1200 check back in April, regardless of underlying income. And pandemic unemployment assistance also tended to be skewed towards moderate and lower incomes (i.e., there was a ceiling in the amount of relief).
This is another important data point on how successful (obviously not universal!) the Congressional stimulus has been in alleviating the potentially devastating impact of the pandemic on households and the economy.
Who’s eligible for COVID-19 stimulus checks? Your questions, answered (cnbc.com)
PUBLISHED WED, APR 1 2020 10:58 AM EDTUPDATED FRI, APR 3 2020 2:46 PM EDT
…Individual tax filers with adjusted gross income up to $75,000 (up to $150,000 for married couples filing joint returns) will receive the full payment. For filers with income above those amounts, the payment amount is reduced and then phased out for individuals whose income exceeds $99,000 (or $198,000 for joint filers with no children)…
********************************************************
[That did not match up with the below statement from this AB article.]
“…One important criticism is that these aren’t median measures. They tell us how the average, not median, household is doing, so they are subject to being skewed by high upper incomes. But the stimulus payments were not matched to income – e..g, every household got a $1200 check back in April, regardless of underlying income…”
So, just because your household got a check for $1,200 in April 2020, then that does not mean that my household got a dime from Uncle Sam back then. And we should not have gotten any. But the income skew criticism should run just the opposite any way, kind of, sort of, but not exactly. Upper income households have spent down savings and even borrowed during the pandemic because home improvement contractors and banks have been offering them great deals. I had my roof replaced in November 2020 and I am getting two bid retractable awnings as soon as the parts come in. I did not get any special deals on price. The top end vendors that I used needed the income to stay afloat. OTOH, I got great customer service.
“… two biG retractable…”
[New rule – no typing before finishing the first cup in the morning.]
The important point that NDD garbled was that households did not receive bigger stimulus checks because they had previously had higher incomes, but rather the opposite with the stimulus checks. UI works a bit different though up to the maximum in that higher past income does warrant higher benefits. With stimulus then it is lower incomes warrant higher benefits. High income households that lost all their income got completely screwed since UI would not begin to pay their bills. Of course, some moderately high income households (e.g., my own) had long standing rules to live on a single income since they were especially vulnerable to layoffs. My wife and I have an income spread of only about 5% of household income.
Ron: a terrific set of comments here.
https://www.washingtonpost.com/business/2021/03/06/biden-stimulus-poverty-checks/
March 6, 2021
Biden stimulus showers money on Americans, sharply cutting poverty and favoring individuals over businessesThe $1.9 trillion package enjoys wide support across the country, polls show, but it comes with political and economic risks.By Heather Long, Alyssa Fowers and Andrew Van Dam
President Biden’s stimulus package, which passed the Senate on Saturday, represents one of the most generous expansions of aid to the poor in recent history, while also showering thousands or, in some cases, tens of thousands of dollars on Americans families navigating the coronavirus pandemic.
The roughly $1.9 trillion American Rescue Plan, which only Democrats supported, spends most of the money on low-income and middle-class Americans and state and local governments, with very little funding going toward companies. The plan is one of the largest federal responses to a downturn Congress has enacted and economists estimate it will boost growth this year to the highest level in decades and reduce the number of Americans living in poverty by a third….