Average US infections last 7 days: 162,365 (vs. latest low of 34,354 on Sept 12) Total US deaths: 266,873
Average US deaths last 7 days: 1,430 (vs. latest low of 701 on Oct 16)
*I suspect the real number is 18-19,000,000, or between 5 to 6% of the total US population Source: COVID Tracking Project
Infections are out of control over much, if not most, of the country. North and South Dakota, the 2 worst States, now have had confirmed infections in over 10% and over 9% of their entire populations (and probably much worse than that since many asymptomatic cases go undetected):
While the earliest hard hit States, NY and NJ, still have had the highest death tolls, 8 more States have suffered fatalities in excess of 1 in 1000 of their total populations:
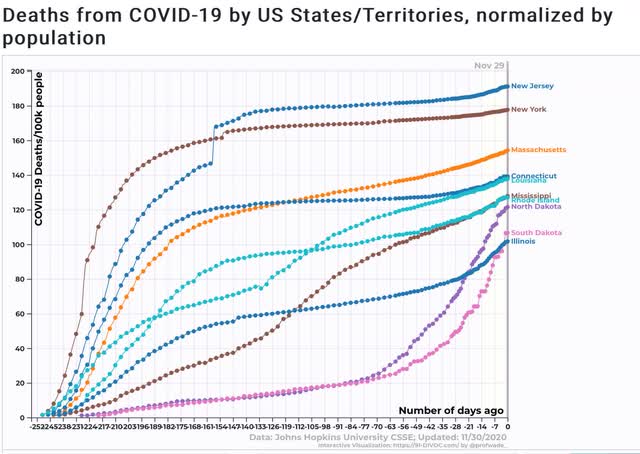
While the Dakotas’ death tolls per capita are increasing the fastest, Mississippi, Rhode Island, and Illinois are also increasing sharply.
Turning to current infections, in the past week these have averaged between 80 to 115 per 100,000 residents on a daily basis in the 10 hardest hit State
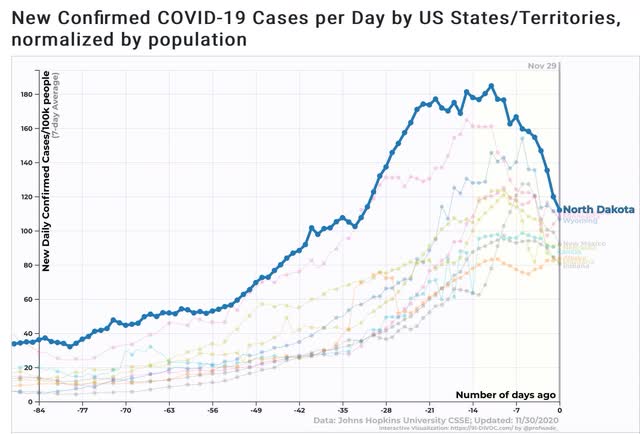
There is a slight silver lining here, in that in 6 of these 10 States – North and South Dakota, Minnesota, Nebraska, Indiana, and Montana – peak infections occurred between November 14 to November 20, one to two weeks *before* Thanksgiving. In other words, the decline is not just an artifact of low reporting over the Thanksgiving holiday weekend. It seems more likely that the “libertarian” northern Great Plains States finally reached their pain threshold, where the population is frightened enough to change to more safe behaviors. Still, the death toll in those States can be expected to rise over the next several weeks, and it seems likely that the Dakotas at least will surpass the total per capita death tolls of NY and NJ by Christmas.
At the other end of the spectrum, there is a little “less bad” if not outright good news. Maine, Vermont, and Hawaii continue to have infection rates on par or even better than Canada, which is the benchmark success story among North American countries:
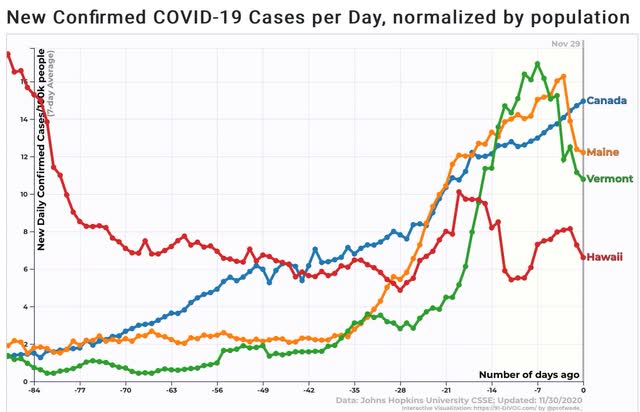
Hawaii in particular continues to appear successful in keeping the pandemic under control.
according to your chart it looks as though the third wave of covid-19 in US peaked out 10 days ago. is it possible that the more. virulent mother virus has mutated into a less virulent daughter virus that is more communicable and is now front-running the mother virus, front running by just enough days to create immunity to both mother and daughter virus, create this immunity before the mother virus arrives?
could this type of mechanism explain what happened in 1918 when the pandemic topped off in October.
There being ethical issues with the Great Barrington Declaration doesn’t mean that the medical hypothesis it was based on is going to be wrong. A week or 10 days after recognized infection, quite near 100% of those people are back out engaging in their lives as before. Many others go through this and never know it. If we presume that some social settings are a lot riskier, then the feedback of immune individuals would preferentially dampen the response in those settings over time. Not textbook herd immunity, but enough to have surges peak and retreat after some time. Maybe 2 months?
Which is why Wisconsin is #4 in the nation in contracting Covid beating out Illinois with 33% of the population that Illinois has. Why are the flatlanders acting in a more responsible way than cheddarheads? Republicans . . .
Run,
The per capita rates may be more telling.
State Cases per 1M People
Sure hope I did that link correctly.
In any case, on a per capita basis over the last few days then highest rates of transmission are in order of high to lower for the highest rate group are KS, SD, UT, WY, MT, and RI.
Ron:
The link worked.
Run,
The linked web page above is a select-a-chart that does a bunch of different summaries along with a group of by state comparisons.