Coronavirus dashboard for December 29: a final look back at the pandemic disaster in 2020
Coronavirus dashboard for December 29: a final look back at the pandemic disaster in 2020
US confirmed cases: 19,132,726*
Average cases last 7 days: 184,005
Total US deaths: 333,118
Average deaths last 7 days: 2,207
Total vaccinated: 2,127,143 (per CDC via Bloomberg)
*Because many asymptomatic people probably never get tests, actual cases are probably more like 26 million, or about 8% of the US population
Source: COVID Tracking Project
The good news is, we finally have started the process of vaccination, and 1% of the population should be vaccinated by the end of this week. The bad news is, at the current rate, it would take over 4 years to vaccinate everyone in the US. I do expect this to ramp up, both as more States get more efficient at administering the vaccine, and because the Biden Administration will be much more activist and competent at ramping up production and improving the supply chain.
As we end 2020, let’s take a look at total infections and deaths per capita so far.
Here are infections and deaths for the US as a whole (note separate scales):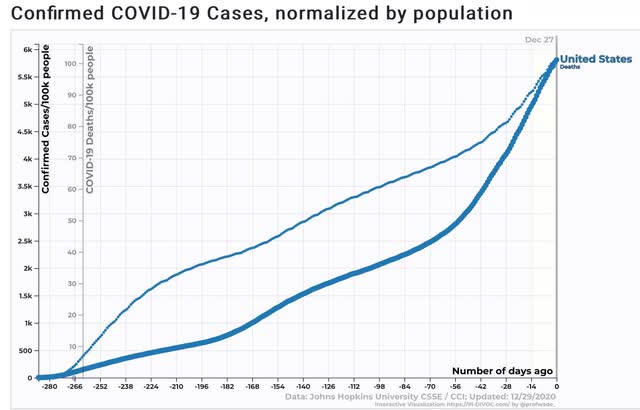
Roughly 1 in 16 Americans has had a *confirmed* infection; 1 in 1000 Americans has died from COVID this year.
Here are total infections by State: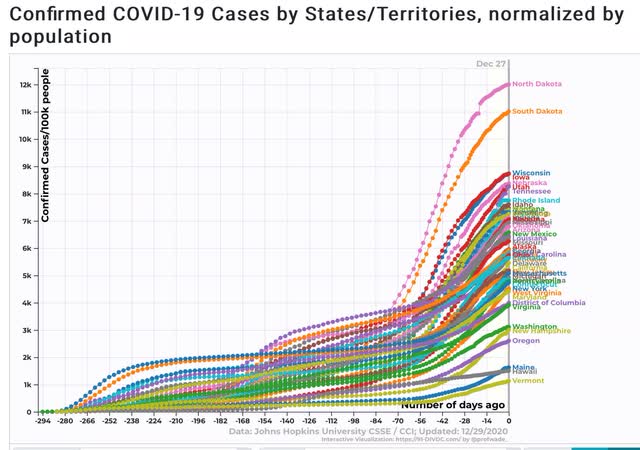
12% of North Dakotans and 11% of South Dakotans have had *confirmed* infections. Between 8% and 9% of the total population of Wisconsin, Iowa, Nebraska, Utah, and Tennessee have also had *confirmed* infections.
At the other end of the distribution, only about 1% to 2% of the populations of Maine, Hawaii, and Vermont have been infected. That is a success story.
Here are total deaths by State:
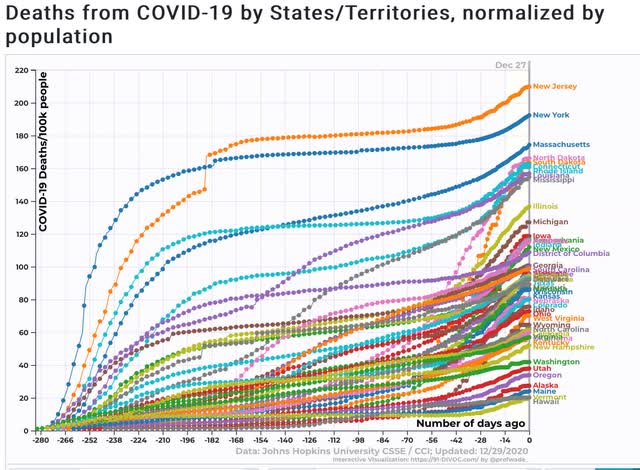
New Jersey and New York, which had horrible outbreaks early, still lead the pack, with about 1 in every 500 residents having died of the disease this year. About one in 600-700 of the entire populations of Massachusetts, North and South Dakota, Connecticut, Rhode Island, Louisiana, and Mississippi have also died of the disease.
Maine, Vermont, Alaska, and Hawaii have the best record, with only 2 deaths per 10,000 population.
Looking at the 7 day average rate of infections shows that the wave that began in early November utterly dwarfs the two prior waves, with North Dakota having the worst result of any State: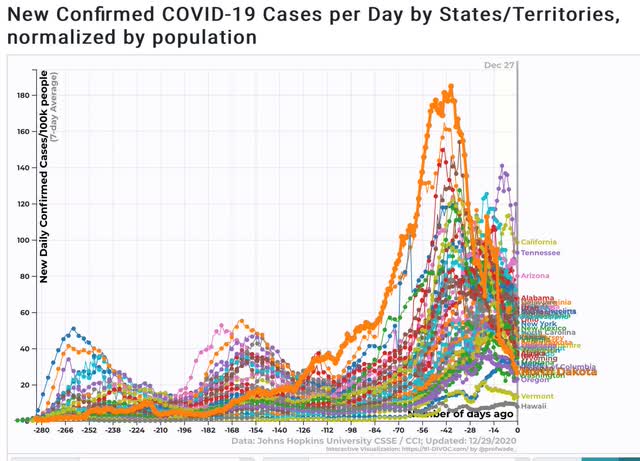
Note that North Dakotans were apparently sufficiently terrified that their infection rate is now one of the 10 lowest in the entire country!
The 7 day average of deaths shows that the initial outbreak in the NYC metro area remains the most lethal:
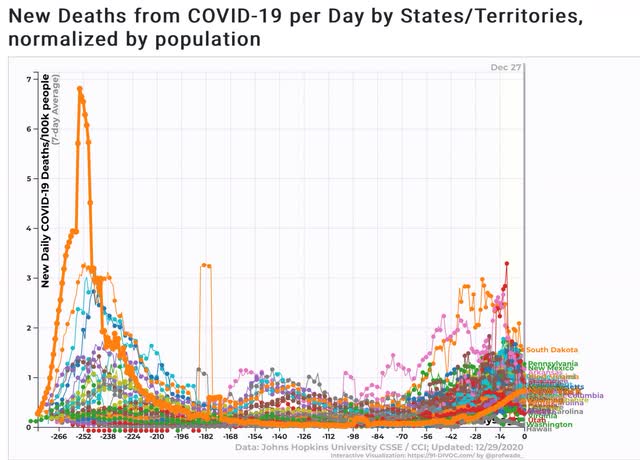
Although Iowa and South Dakota’s recent spikes are in the same ballpark.
I expect the recent horrific rates of infections and deaths to continue throughout the winter, although there will be alternating waves of panic and complacency, depending on the recent experience of each State. Between vaccinations, warmer weather, and a competent new Administration in Washington I expect real subsidence to finally begin by about late March or early April.
Other than fools who refuse to take proper precautions against spread and cause outbreaks radiating from social gatherings, then the predominant “community spreads” are among those that necessarily either work or live in dangerous contact proximity to many other people. Front line healthcare workers and long term care residents were first, then food processors, restaurant workers, and of course students and teachers, but essentially anyone that is not safe working from home that is also necessary and then the less necessary unemployed or out of school so they can get back to work or school.
if we had community daycare centers with Internet access and a general inclination to use already developed computer based learning systems instead of each local school board rolling their own then education might have gotten a windfall gain instead of a windfall loss. Few communities have embrace this opportunity. In any case, we get a much faster handle on community spread if we use a directed approach instead of a random attack. We appear to be fortunate enough that the healthcare professionals are aware of the obvious transmission paths and are in no mind to not have a firm grasp on the obvious.
Give a moron a calculator and all you get is a calculating moron.
https://www.nytimes.com/2020/12/31/opinion/coronavirus-vaccines-expiring.html
We Came All This Way to Let Vaccines Go Bad in the Freezer?
America did not sufficiently plan for how to get millions of people vaccinated.
By The Editorial Board
The editorial board is a group of opinion journalists whose views are informed by expertise, research, debate and certain longstanding values. It is separate from the newsroom.
Dec. 31, 2020
It’s been two weeks since U.S. officials launched what ought to be the largest vaccination campaign in the nation’s history. So far, things are going poorly.
How poorly? Untold numbers of vaccine doses will expire before they can be injected into American arms, while communities around the country are reporting more corpses than their mortuaries can handle.
Operation Warp Speed has failed to come anywhere close to its original goal of vaccinating 20 million people against the coronavirus by the end of 2020. Of the 14 million vaccine doses that have been produced and delivered to hospitals and health departments across the country, just an estimated three million people have been vaccinated. The rest of the lifesaving doses, presumably, remain stored in deep freezers — where several million of them could well expire before they can be put to use.
That’s an astonishing failure — one that stands out in a year of astonishing failures. The situation is made grimmer by how…
*
[Get the rest at the link. Come on = it’s safe even if you are not. It’s the NY Crimes for Pete’s sake….]
My wife lost her first relative to the pandemic yesterday. He was old, like me. Now he is dead and I am not. My wife has just learned some appreciation for the difference. Covid-19 risk of death is now real to her at last.
RW:
What is this old crap? My Sifu, a black belt in “wing chun do” suggested one time we should go to a bar sometime. He is short and stumpy and I look old. The third guy is nerdy-looking. Me ?I am a Blue belt (been a while since I have practiced).The nerd is the same as I. He suggested we wait until the others started picking on us and treat them to a lesson.
Because we are old does not mean we need to be stupid or feeble. Stupid enough to expose ourselves to the risk of Covid. Stupid enough to allow ourselves to be less capable. Dumb due to not exposing ourselves to more education by reading etc. It is still up to us to rage against that proverbial “dying of the light!”
Why he died, I am not sure, and I hope it was not something I supposed.