Models based on economic fundamentals, however, *can* forecast, because in the case of leading indicators, what the data is likely to show on Election Day is “baked in the cake” months before. For example, the model based on Q1 polling plus the Index of Leading Indicators are the end of Q1 already forecasts a Biden victory, by a substantial margin. That’s because the Index is supposed to tell you what the economy might be like 6 to 8 months later.
The short leading indicators and the 2020 Presidential election forecast
The short leading indicators and the 2020 Presidential election forecast
As I pointed out on Sunday, polls and poll aggregations really aren’t forecasts, they are nowcasts. They tell you who would win and by how much *if the election were held today.* They don’t tell you whether or by how much that is likely to change over the next few months. Further, candidates, campaigns, and voters react to them, and so change the dynamics. And in the case of several of them, most notably Nate Silver’s aggregations, since they only give you *probabilities* of each candidate winning, in a fundamental sense they are non-falsifiable — e.g., “well I *told* you that Candidate X had a 6% chance of winning, my model was correct!”
Short leading indicators are those which forecast where the economy is likely to be over the next 3 to 8 months, rather than a year, later. Several decades ago, Prof. Geoffrey Moore identified 11 of them:
S&P 500 stock price index
Average workweek in manufacturing
Layoff rate under 5 weeks
Initial claims for unemployment insurance
ISM manufacturing vendor performance
ISM manufacturing inventory change
Journal of Commerce change in commodity prices
Change in deflated nonfinancial debt
New orders for consumer goods and materials
Dun and Bradstreet change in the business populationContracts and orders for plant and equipmentWith the exception of the Dun and Bradstreet data (which I don’t think even exists anymore), the other 10 are still around, and the results through June are in for all but the two “new orders” categories. So taking a look at them ought to give us a good look at what the economy is likely to look like just before Election Day. To cut to the chase, they have all improved some of them almost back to pre-coronavirus levels, since April, but in general they are still worse than they were at the beginning of this year. So here they are in order.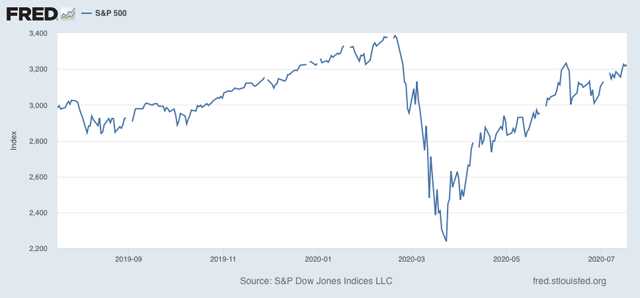
S&P 500 stock price index:
These have not made a new high since February, but have recovered over 3/4 from the March lows.
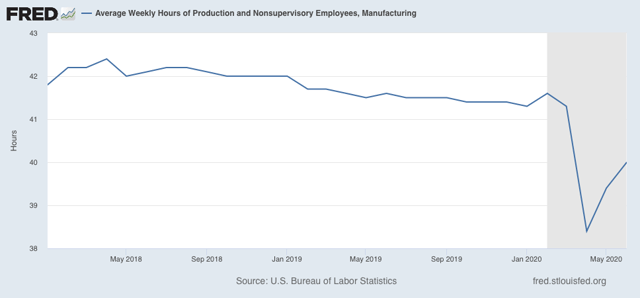
Average workweek in manufacturing:
These have improved since April, but are still less than half the way back to pre-coronavirus levels.
Layoff rate under 5 weeks
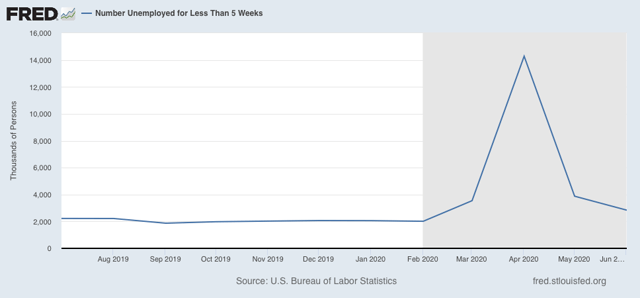
Initial claims for unemployment insurance
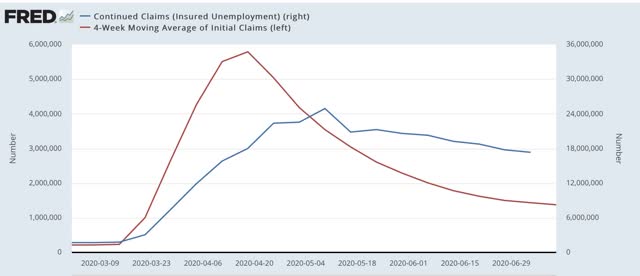
The former has improved by about 3/4’s from its worst levels. The latter has improved by about 90%. But both are still at levels comparable to their worst during the Great Recession.
ISM manufacturing new orders
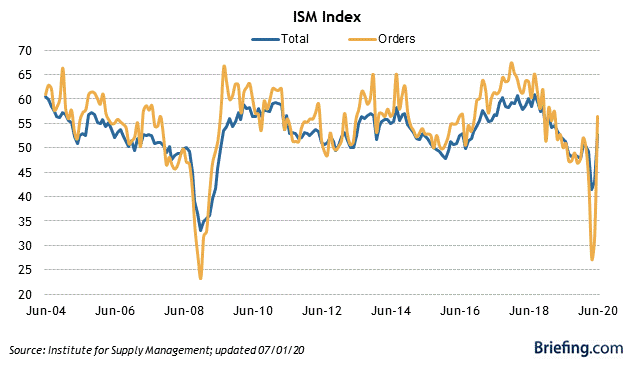
New orders have returned to expansionary levels.
Journal of Commerce change in commodity prices
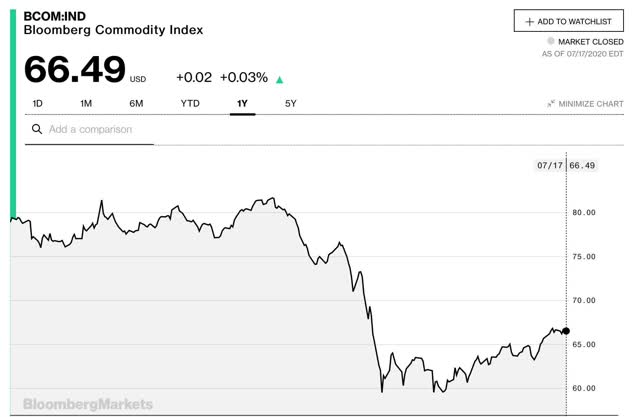
Commodity prices have only rebounded by about 1/3 to their pre-coronavirus level.
Change in deflated nonfinancial debt
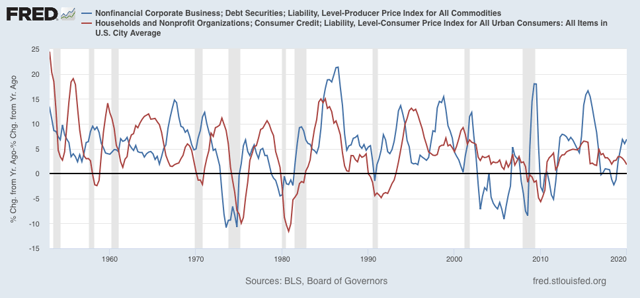
This is only updated quarterly. Through Q1, consumer nonfinancial debt was decelerating, while corporate nonfinancial debt was steady at an elevated level.
New orders for consumer goods and materials
Contracts and orders for plant and equipment
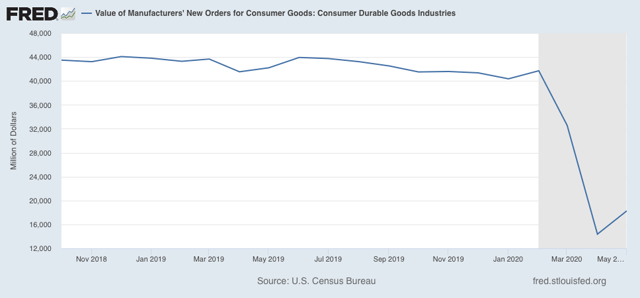
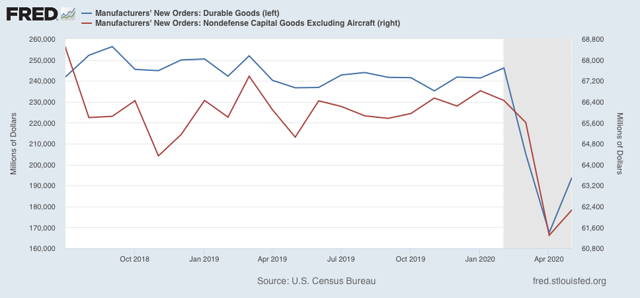
This data is only available through May. At that point, the rebound was slight compared with its decline when the pandemic struck.
Conclusion:
When we examine all of the short leading indicators, we see an economy that is set to improve in the next few months, but not all the way back to where it was before the pandemic struck in March. Needless to say, this will be affected by the course of the pandemic – whether it leads to partial or total shutdowns again, whether by edict or simply by lack of consumer confidence – between now and then.
Because Biden has been leading at all points this year, this points to a Biden victory, by more than the percent by which he was leading in the first quarter, but by less than he has been leading in the last couple of months.
Just do not see it particularly if the Feds do not prop things up with massive federal stimulus. Unemployment is over 10 per cent in the populated parts of the country and entire industries are teetering on the brink with no end in sight. The moron in chief had one chance—effectively deal with the pandemic and he blew it. The economy will not be better on November 3 and the only reason the S&P is back right now is because the smart money anticipates a Biden win. Lower tax rates on income is not as good as lower income is bad. NASDAQ is a little different because the new normal will be even more tech centric than it would have been without the virus. All of the deficit spending gave the economy a little pop but that is ending with only a too little too late response from the GOP. As the moron in chief put it “ things will probably get worse”. He was speaking about the pandemic but it applies to the economy as well.
Doesn’t admitting to this “Needless to say, this will be affected by the course of the pandemic – whether it leads to partial or total shutdowns again, whether by edict or simply by lack of consumer confidence – between now and then.” make examining all of the short leading indicators a now-cast too?
honest question: how is it different?
I do not believe there are very many people who vote based on the state of the economy.
If Trump campaign strategy efforts
continue, expect more guv’mint
thugs in urban areas, provoking
riots & general mayhem.
‘Make America Authoritarian!’
Also, of course, ramp up vote/voter
suppression efforts. Post-election,
challenge results!
Do not go gentle into that good night!
“I do not believe there are very many people who vote based on the state of the economy.”
[There must exist a respectful response to that comment, but it is beyond my capability to come up with one :<) ]
Ron,
What was wrong with the economy in 2018 when the Gop took a beating?
Biden Banks $242 Million as Big-Name Donors Write Huge Checks
Former Vice President Joseph R. Biden Jr. raised tens of millions of dollars in the last three months from major donors who gave more than $100,000, relying on some of the Democratic Party’s deepest pockets to sharply shrink President Trump’s financial advantage, according to new federal filings.
Mr. Biden’s campaign announced on Thursday that he entered July with $242 million in the bank, up from less than $60 million at the beginning of April. He still has less money than Mr. Trump, who reported $295 million, but the cash gap is suddenly far less daunting.
Mr. Biden’s biggest benefactors in the second quarter of 2020, when he became the presumptive Democratic presidential nominee, represent a who’s who of billionaires and influencers in Silicon Valley, Hollywood, Wall Street and beyond. …
Mr. Biden had previously announced that he narrowly edged Mr. Trump in total fund-raising with their parties in the last full three months, $282 million to $266 million. New Federal Election Commission filings released late Wednesday shed the first light on the biggest contributors powering Mr. Biden’s financial turnaround, from a candidate who struggled to raise money in the primaries to one now outpacing the incumbent president. …
Mr. Trump has previously leaned heavily on major donors to bankroll his run, tapping many of the mainstays of the Republican money circuit months ago. But in the spring, as the coronavirus pandemic shut down traditional fund-raisers, he relied mostly on online contributions, with $167.6 million of his donations — more than 62 percent — coming via the Republicans’ main online processing site, WinRed, new records show.
Mr. Trump still had some major contributors, raising $27 million via his joint committee with the Republican National Committee that can accept outsize checks. But that was a fraction of the sum that Mr. Biden raised from larger contributors. …
The Lincoln Project raised nearly $17 million in the second quarter, with donations from some of the Democratic Party’s biggest donors. It has earned a reputation as an irritant to Mr. Trump, running ads during some of the famously voracious television consumer’s favorite shows. …
EMichael, I think you could have used 2016 as an example as well—voters switching horses in the middle of a sustained economic expansion which is the reason I was hopeful of throwing the moron in chief out even if there had been no pandemic. I think the real rule is that in good times the economy is not an important factor, but in bad times as Bill Clinton was famously told” its the economy, stupid”. Certainly, Hoover, Carter, and H.W. Bush discovered that a bad economy is fatal to an incumbent. This is not 2016 all over again with rank and file Republicans following the deplorables off a cliff like lemmings rushing to the sea and a lot of independents saying what the hell we will give Trump a chance. Everyone now knows he is incompetent and with 81% thinking the country is heading in the wrong direction, I do not think there is anything about the economy in the next 100 days which will save the moron in chief. At least I sure hope that is the case.
EMike,
What is it that you always say about mid-term elections and incumbent parties? In 2018, it was that times two, but yes, not the economy which by most measures matters for POTUS rather than mid-terms. Even for POTUS elections and coattails, it is usually only a bad economy that matters. Otherwise, a lot of different things matter more than a good economy, but little matters more than a bad economy.
Trump is trying to prove to us that all lives matter, not just black lives matter, by killing off as many of us as he can with Covid-19 by election day.
Paul:
It’s different because the now cast polling takes into account people’s current feelings and projections about their economic/financial health. These indicators show where the economy will be in the near future; the more people that are better off in the near future, the more likely they are to be forgiving of the incumbent. If these indicators projected the economy to remain the same as it is now then you could expect the polling to be the same ceteris parabus.
EMicheal & Ron:
“I do not believe there are very many people who vote based on the state of the economy [according to best evidence rather than their perception based on its impact on them personally]” <- does this work?
I think everyone tries the justification that an economy that is good for them must be good for everyone (deserving) and an economy that is bad for them then it must be failing everyone. This would also explain how in Jan 2017 the economy was in tatters and in Feb 2017 it was rescued and amazing according to conservative media.
Idriss Z,
Yes, you are certainly in the ballpark and keeping loose enough might even swing for the fences.
Post 2008 almost everyone that I knew, which was through work except for my in-laws at that time, had jobs and their own in-laws or other relatives that did not have jobs that had moved in with them. Among that circle of acquaintances there are only a few liberals, yet about half of them, including my conservatively raised wife, voted for Obama in 2008. Depending upon one’s opinion of maintaining close family ties, then such circumstances might have a profound effect on one’s perception of economic results for the deserving.
My wife had always liked John McCain, but Sarah Palin was a bridge to nowhere too far even for her conservative orientation.
My wife is ten years my junior. I was raised by Greatest Generation New Deal Democrats. FDR was sacred in our house, second only to Jesus Christ. My wife was raised by Silent Generation Republicans which were a backlash to the New Deal. To them Reagan was the Second Coming.
‘Trump is trying to prove to us that all lives matter’
That suggests a degree of empathy way beyond
what he has. He may be trying to prove that
loyalty to him is all that matters.
Trump’s Portland tactics are the stuff we decry in other countries
Boston Globe – Stephen Kinzer – July 24
Using unidentified paramilitary squads to maintain order is deeply anti-democratic.
Squads of heavily armed men, often in uniforms without identifying insignia, attack suspected enemies of the state, throw them into unmarked cars, and carry them away. This is the scenario that has unfolded in Portland, Ore., over recent days. Although it is new in the United States, in other parts of our hemisphere it is a familiar tactic. I saw it many times during years of covering repressive regimes in Latin America.
In Argentina during the 1970s, secret police officers would arrive at the homes of dissidents, usually at night, and grab their victims without identifying themselves. For decades in Guatemala, men with no insignia regularly attacked protesters. In El Salvador during the 1980s, newspapers carried almost daily reports of kidnappings and killings carried out by what were chillingly described as “heavily armed men in civilian clothes.”
Police in every country have a duty to maintain order. Some do it more harshly than others. Yet in a state of law, police officers should be identifiable, either by name or badge number or through insignia that shows who they work for. The use of paramilitary squads, whose members apparently work for the government but are otherwise unidentified, is deeply anti-democratic.
This approach to repression was not born in Latin America. During World War II, Nazi administrators in occupied countries were instructed to deal with troublemakers through a policy called “night and fog.” Night is when victims were abducted, and fog was all that their loved ones encountered when they tried to find out what had happened.
Conditions in Portland are hardly that dire. Death squads, secret detention centers, and clandestine executions are not part of American life. The use of unidentified police, however, takes us across a scary line. It gives officers anonymity that shields them from accountability.
What makes the situation in Portland so extraordinary is that these enforcement squads have been deployed against the will of the mayor and the governor. The state’s two senators, decrying what they call “paramilitary occupations,” have introduced a bill they call the “Preventing Authoritarian Policing Tactics on America’s Streets Act.” One co-sponsor, Senator Chris Murphy of Connecticut, made the essential point: “Without identification there is no way to hold these officers accountable, and there is no way to know if they are really federal officers.”
By coincidence, protests erupted in Portland as anti-government demonstrations were also raging in Hong Kong. In both places, some protesters have been violent, breaking windows, setting fires, and in the case of Hong Kong even invading and occupying the airport. Yet American politicians who cheer the protests in Hong Kong denounce those in Portland. Senator Ted Cruz has called the Hong Kong protests “an existential battle for liberty,” but condemns the protesters in Portland as “violent criminals seeking to destroy America.” Senator Marco Rubio lamented that police in Hong Kong are “so brutal to the people of Hong Kong, young and old, who are protesting.” Yet he supports federal police actions in Portland because there, “extremists are taking advantage of demonstrations to instigate violence.”
Shedding crocodile tears for victims of police repression in other countries is an old habit in Washington. These days, much outrage is directed toward the government of Nicaragua, which over the last two years has used brutal tactics to crush a widely popular protest movement. That repression has been carried out by squads made up of police operatives and armed civilians, usually wearing ski masks or other face coverings. Earlier this year the US Treasury Department imposed sanctions on Nicaragua’s national police and three police commanders. Treasury Secretary Steven Mnuchin said he acted because Nicaraguan police were engaged in “a campaign of violent repression.” He said the United States rejects police operations that “seek to silence pro-democracy voices.”
When the coronavirus crisis exploded in the United States, President Trump insisted that responsibility for dealing with it lay not with him, but with governors. Yet his belief in states’ rights evidently does not extend to law enforcement. Oregon Governor Kate Brown begged the acting secretary of homeland security, Chad Wolf, who is overseeing the armed squads patrolling Portland, to remove them and leave the job of crowd control to local and state police. Wolf was unmoved. “I don’t need invitations by the state, state mayors or state governors to do our job,” he asserted. “We’re going to do that, whether they like us there or not.” Governor Brown concluded that “he is on a mission to provoke confrontation for political purposes.”
Whether protesters pose such a danger to public safety that they must be violently suppressed is a legitimate subject for debate. Yet in responding to protests, political leaders should respect two principles: The choice of tactics should be up to state and local authorities, and the officers sent to restore order should be identifiable. When we abandon those principles, we embrace the repressive practices that we so vigorously condemn in others.
Thanks for the insight RC, curious, would you characterize the non-GOP (ie: centrists/ moderates/ independents/ progressives/classic dems) to be agnostic/secularist and not given to worship any political entity or as pagans worshipping many different figures for each denomination? (I minored in religions and like the metaphors you brought up).
And good stuff Fred, I didn’t put together the HK hypocrisy. Also, was jt here that someone brought up the point that we haven’t seen a woman officer engaging in brutality like kicking someone in the face? It also provides an interesting comparison w/r/t the economic indicators-> if HK and mainland China returns to consistent growth, will enough people be well enough to look past the violation of rights and liberties? And if so, you can be sure that is the model the GOP will emulate.
Idriss Z,
At least to some degree there must be a lot of both. Like it or not, the US is rich in diversity of opinion, faith, ideology, philosophy, scientific knowledge, understanding of philosophy and psychology, and parenting skills. Again my personal acquaintances over the last twenty years have been almost entirely through work and in-laws.
By about forty years ago all of my radical friends had moved away from central VA. We did not keep in touch much for a while as our lives were changing from radical movements to supporting our own families. Later I got back in touch with most of them, then about half of them died untimely deaths. I guess we all became more conservative if you consider that we began from a base of Abbie Hoffmann, MLK, Malcolm X, Stokely Carmichael, Gerry Garcia, Phil Ochs, and John McLaughlin. It is not that our tastes had changed that much, but our lives had and, to be honest, that revolution faded into oblivion after 1968 and was no more than a distant memory by the time of POTUS Reagan. I have not known any new people like my old friends in subsequent years nor have I known any new people that I really wanted to know all that well. In the 60’s and early 70’s my life was open and social. I had scores of friends and was invited to every party. Of course we all got high a lot too. Now, I am practically a teetotaler and a hermit.
Those charts look great, but I rely on goose entrails. If nothing else, I get to eat the goose. (Insert it matters whose goose is cooked joke here.)
Ron,
I wish I could time machine to meet you back then. This is why I (and those around me) always considered me a “moderate.” I am a huge fan of Aesop’s tortoise, a mentor of mine would ask, “why do we have time?” the answer of course being “so everything doesn’t happen at once.”
It takes time to do everything you mentioned right. Every progressive idea is the right thing to do. It is impossible to do them all at once. We must choose, and do things right, one step at a time, then onto the next one…
Idriss,
Then I wish you fair winds and following seas.
Idriss,
If our early adult lives were a passion play based loosely upon “Stranger in a Strange Land” rather than the Gospels, then before being sent to Viet Nam I was playing Valentine Michael Smith, but after returning from Viet Nam then I was playing Jubal Harshaw.