– by New Deal democrat
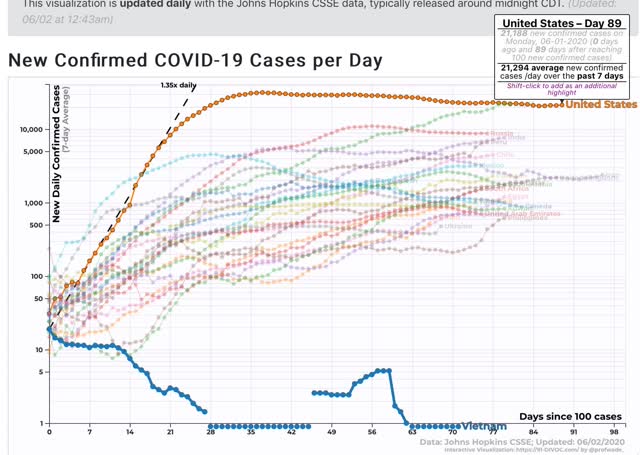
The US seems to have settled into a status quo where it accepts 20,000 new coronavirus infections and 1,500 deaths each day. This is what I forecast about a month ago, as lockdown regimens were abandoned in much if not most of the country: periods of waxing and waning waves of infection because there simply isn’t the political or social willpower to “crush the curve.”
Meanwhile Vietnam, a developing country with a 90,000,000 population, which immediately went on a regimen of testing and tracing per the WHO recommendations, and has nearly universal wearing of masks, has not recorded a single coronavirus death. Below I show cases, because there are no deaths in Vietnam to show!:
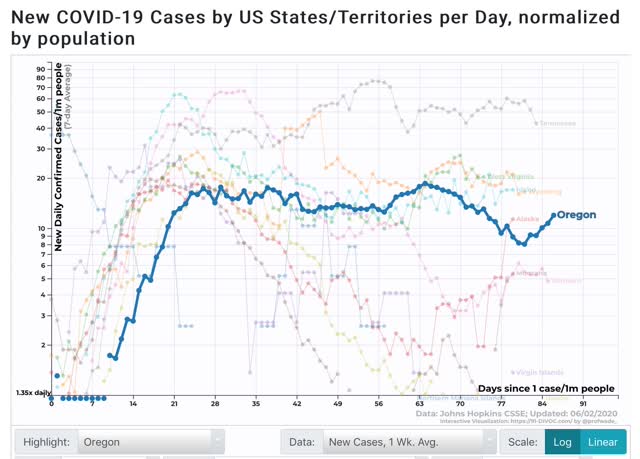
Domestically, it continues to be the case that only Oregon, with a population of about 4.5 million, in addition to several rural States and the island State of Hawaii, has “crushed the curve”:
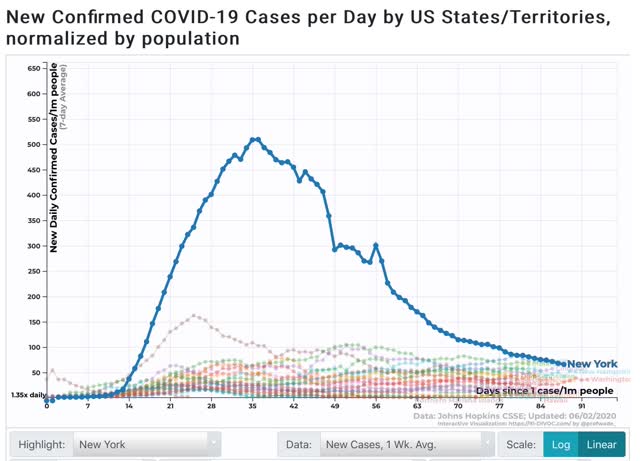
States that had early outbreaks, like NY, have seen dramatic reductions, but as the graph below shows, even with a -87% decline in new infections, NY still has more new infections even on a per capita basis than half of all the States, as shown in the below graph of new infections in the bottom 25 States plus NY:
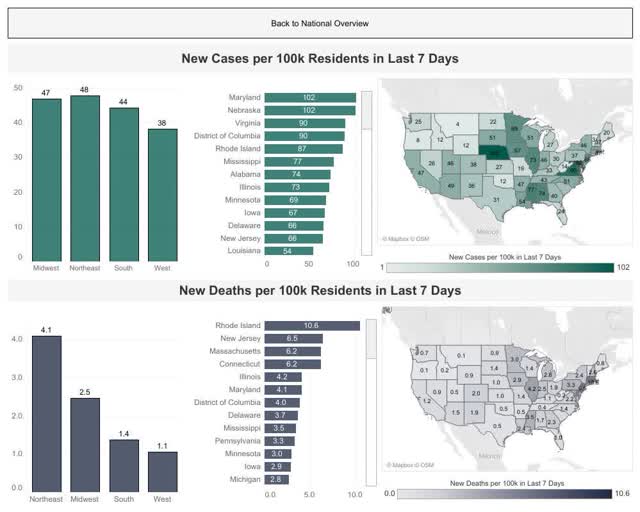
Here is a map showing new cases and deaths per capita for all 50 States, from Conor Kelly, who continues to do great graphic work:
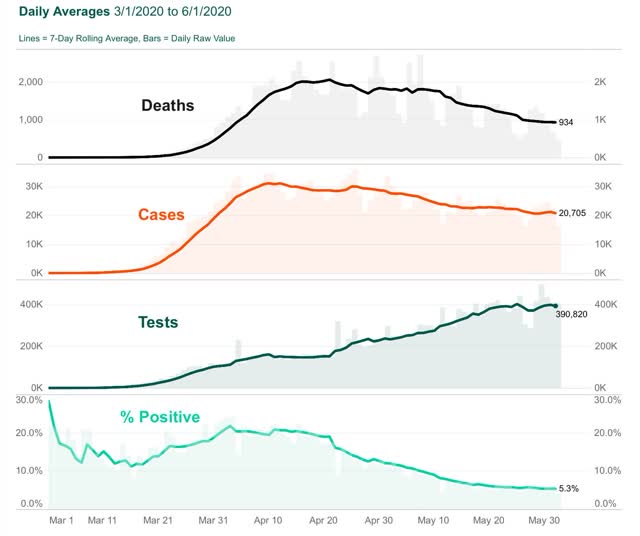
Here is his graphic overview of deaths, new cases, testing, and the % of positive tests:
In the past 14 days, the 7 day average of new cases in the US has only declined by 1,624 cases, from 22,918/day to 21,294/day. Of that, 767 have been in NYS, in which they have declined from 2,045/day to 1,278/day.
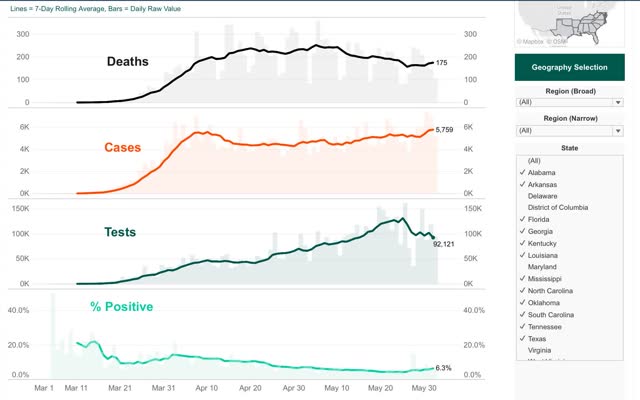
What about in States that have most egregiously ended restrictions? While the individual State data is noisy, and in some notorious cases (FL and GA) very unreliable, the below graph (again from Conor Kelly) for the Confederacy as a whole, shows that new cases started to increase as of April 28, while deaths have only increased after May 26, a 4 week lag:
Between some very bad social behavior over Memorial Day weekend and the civil unrest of the past week, I would expect new cases to increase in many areas in the next 14 days, and deaths to follow a week or two after that.
Unless a larger State like Washington, NJ or NY demonstrates by example that “crushing the curve” is possible in the US, I expect this waxing and waning around the status quo to continue until winter generally and specifically until at least next January 20.
June 3, 2020
Coronavirus
US
Cases ( 1,894,646)
Deaths ( 108,771)
June 3, 2020
Coronavirus
US
Cases ( 1,900,931)
Deaths ( 109,097)
I find the comment about January 20 of next year unclear. The significance of the date is apparent, but not any particular relationship with COVID, other than a useful vaccine is likely will be much closer to realization by that date and if there is a fair amount of immunity, then herd immunity will be closer also. That’s with Trump or Biden. Whatever you think should be happening right now, the circumstances leading you to believe this will be very different by next year. They will be very different by election day. They likely will be observably different by the end of this month. Those non-crushed, pretty flat curves are going to be okay with lots and lots of Americans, plus they probably will drift down from here, with a pop up now and then. I just feel you are selling your own book a little short. Testing capacity will go up this month and all summer probably and whether or not it gets super-optimized, it is going to be used effectively. Counties are learning from each other and states are too. The control of the virus will be tighter at the end of the summer than it is today and today it is good enough for most states to resume a lot of activities. From a public health point of view I expect that there will be not much specifically to be done by next January other than work on general improvements for the future. The measures you have educated us on are happening.