Trends in US States compared by coronavirus response
Trends in US States compared by coronavirus response
I mentioned over the weekend that I wanted to break out and look at some different aspects of the coronavirus pandemic.
Here’s the first: how are States at different ends of the restrictions and testing spectrums faring?
Seven States have never even mandated lockdowns. Let’s look at these, alphabetically:
Arkansas:
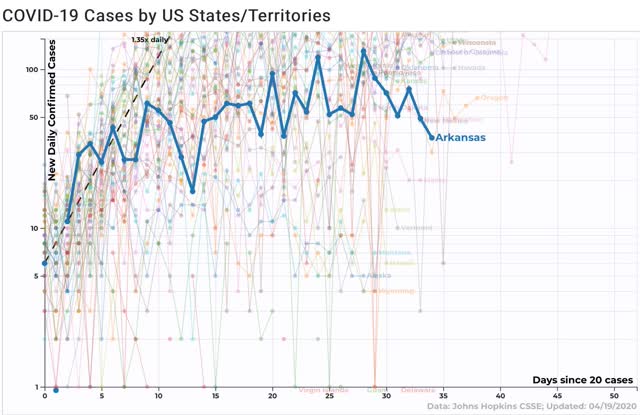
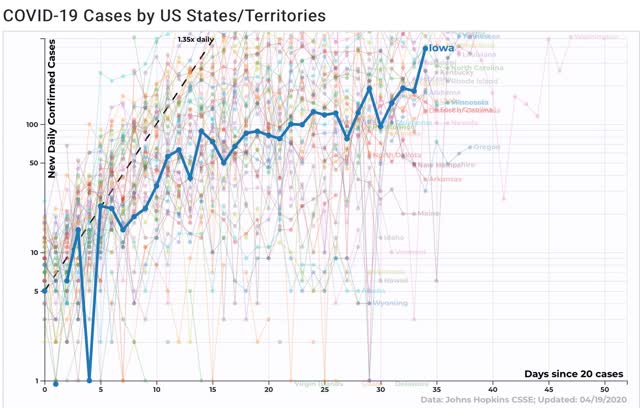
Figure 1
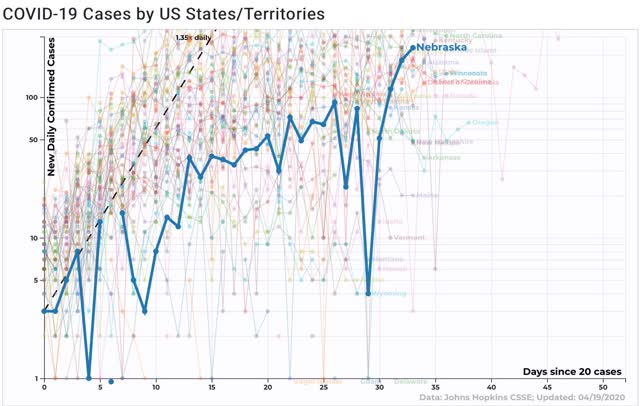
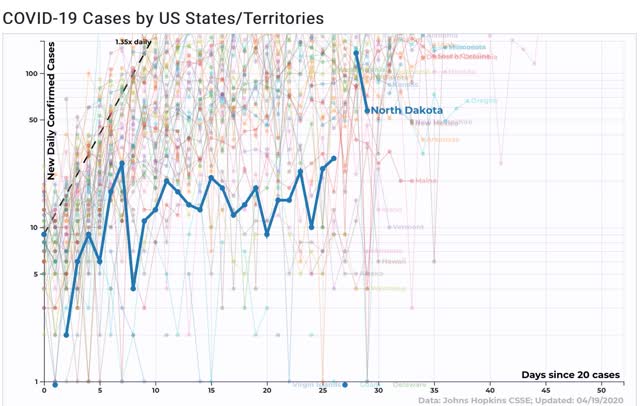
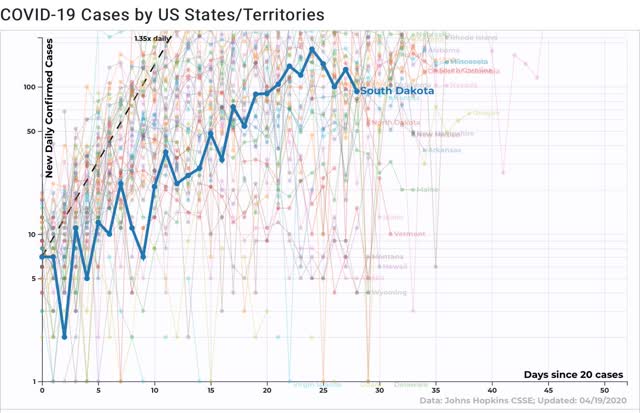
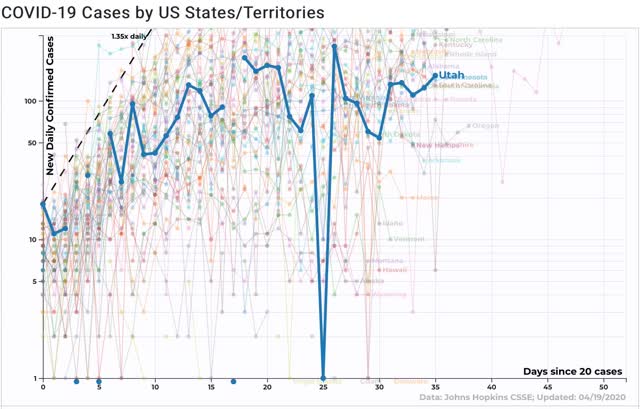
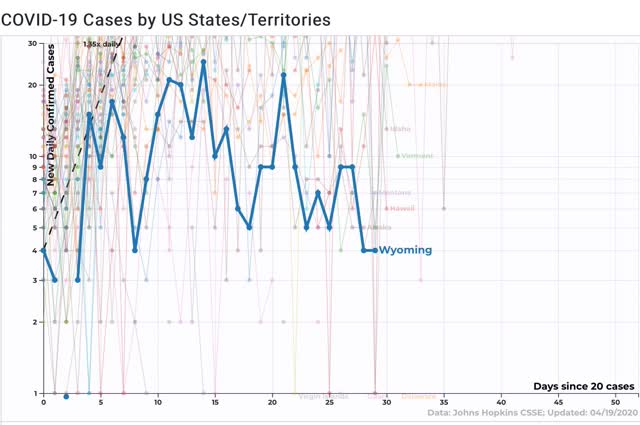
Four of the seven continue to show a trend of increasing infections. Arkansas and Utah appear to have plateaued, and Wyoming has such a small number that it’s decline is in single digits and not significant. The virus in the 4 States with increasing numbers isn’t under control at all — but all of these States have small populations and are very rural. Urban areas in several (Iowa and Utah) are in lockdowns.
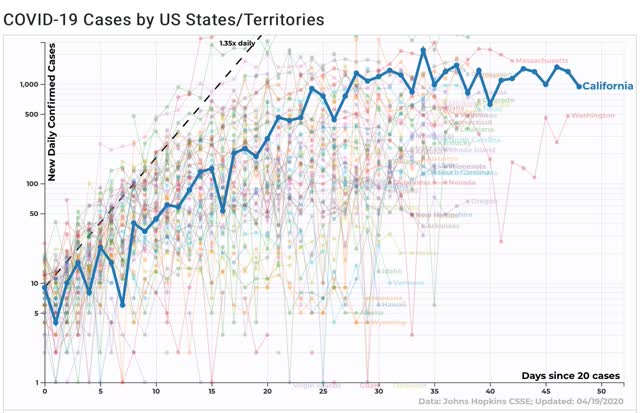
By contrast, here are 2 the States that got real – California and Washington State – real quick:
California:
Washington:
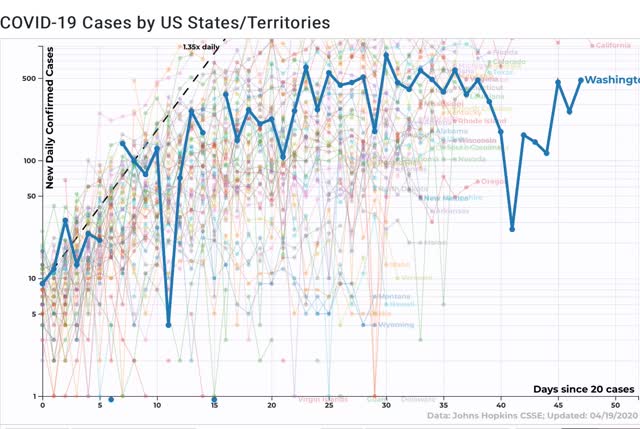
Both of these are pretty clearly past their peaks, although the recent rebound in Washington is concerning.
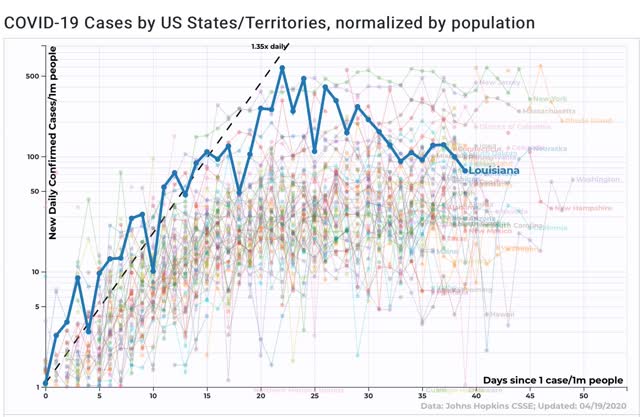
Louisiana, which had a severe outbreak after Marci Gras, and reacted decisively, is particularly heartening:
A similar pattern is shown for New York, which also appears to be past its peak.
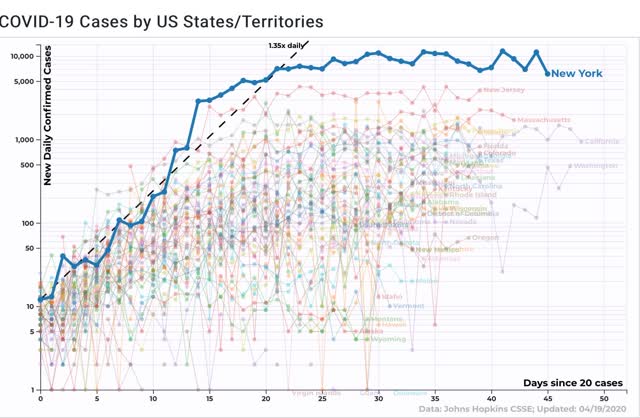
Finally, here is Rhode Island. It looks awful, but actually what has happened is that this State really ramped up testing. As a result, it found a lot more cases:
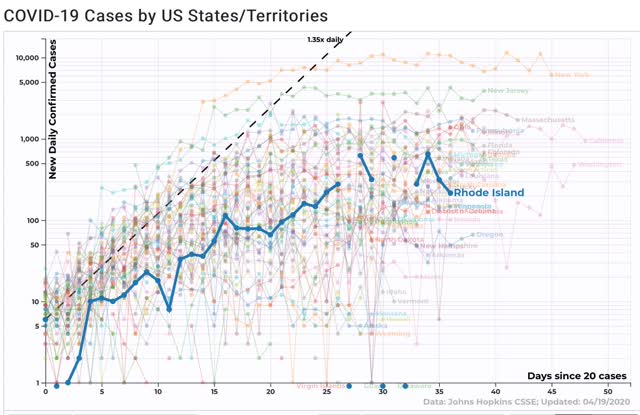
New York did the same thing. Increasing testing is going to show a lot more infections, which is probably an important reason why Trump has been dragging his feet so badly on this issue.
The LAT posted that the virus may have been in California in December. Santa Clara reported cases in early February.
In the interest of consistent data, data transparency, and best means of presenting available data:
I think we need an easy to intuitively interpret way to track and compare states ( as well as countries, and counties ). I think a very good implementation of a visualization tool can be found here: rt.live. This uses a seven day averaged rolling R(t), presenting a plot that I think of ( without the specific data training ) as a smoothed second derivative of new cases, displayed so you can easily see and compare different states, and see where they are now compared with other states as well as the state’s trend and an absolute 1st derivative ( with a smoothed version ) overlaid.
There is an accompanying set of explanations of the methodology that looks to me like it represents how data centered epidemiologists would approach this. So not quite open source but pretty close. And a blog http://systrom.com/.
As for transparency, consistent data, etc, I guess that is too much to add to this. But each data set state by state has somewhat different methodology and those change over time. What is one man’s political bludgeon ( China adding counts of those who were never in a hospital setting but did show symptoms including death as a special symptom , as lump sums of new cases and new deaths, without redistributing the data to the historical dates for example; now also done by at least several states, and the same man’s political bludgeon ( the rate of testing and reporting and how that affects the day by day news cycle opportunities for deceit and gaslighting ) ought to be dealt by responsible parties by ongoing review of past conclusions.
The rt.live explanation around some of these corrections especially testing rate is that their presentation model quickly adapts to the blips and dips. So you don’t need a well trained eyeball on noisy data to see the trend you really need to see.
To which I say, WTF Ohio and Georgia, why do you think you of all the states should be on the leading edge of those contemplating reopening restaurants, fitness centers, massage and tattoo services?
Charlie,
“…To which I say, WTF Ohio and Georgia, why do you *think* you of all the states should be on the leading edge of those contemplating reopening restaurants, fitness centers, massage and tattoo services?”
[*Assumes facts not in evidence – in the most hyperbolic fashion imaginable.]