Rates of testing, positive tests, and new infections by State
Rates of testing, positive tests, and new infections by State
So that I don’t lose them, I wanted to publish both the rates of testing (and positive tests) by State, as well as the (Rt) or rate of new infections for each. Both of these are as of last week.
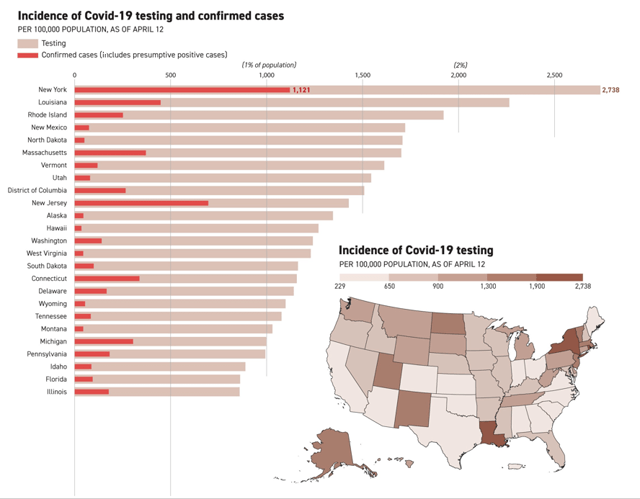
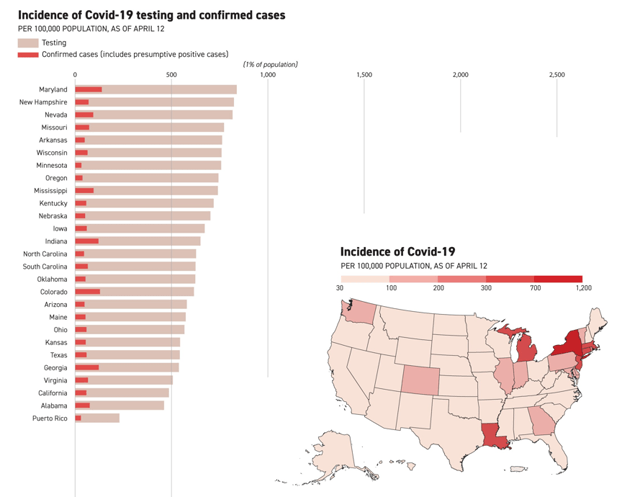
Here is the rate of testing (pink) and rate of positive tests (red) for each State:

Figure 1

Figure 2
Here is the (Rt) rate of new infections by State (the skinny lines at the top of each are the Confidence intervals):
Figure 3
t’s, which are less than 1, I.e., new infections are actually declining.
By contrast, Georgia, which just rescinded its lockdown, is one of the 5 worst States for rate of testing, and is in the upper range rates of growth in new infections. In other words, Georgia isn’t plateauing, and has a lot more infections that it isn’t catching. Coronavirus will be an unforgiving teacher.

