Real retail sales continue flat in January; production sector still in recession
Real retail sales continue flat in January; production sector still in recession
Retail sales increased nominally by +0.3% in January, while December was revised downward by -0.1%, for a net gain of +0.2%. Since consumer inflation increased by +0.4% during those two months, real retail sales were unchanged. On a per capita basis, they declined less than -0.1%.
This means that neither real retail sales, and real retail sales per capita have made new highs since last August. The former is off -0.4% and the latter -0.6%. Here are both measures, normed to 100 as of then:
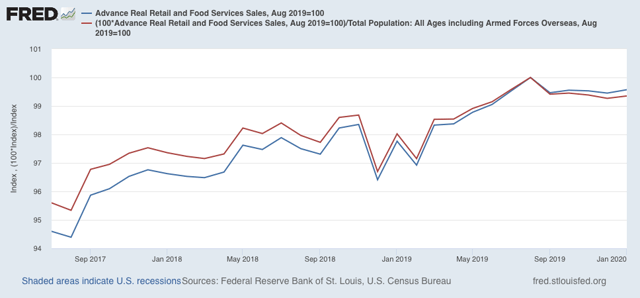
As I’ve noted several times recently, We’ve had similar periods of flatness previously during this expansion, for example late 2018 as shown in the above graph. It would still take one more month of a reading below the August peak for me to flip this to neutral. For now it remains a very weak positive.
The bottom line is that, while there is some flatness, there are no signs of the consumer actually rolling over.
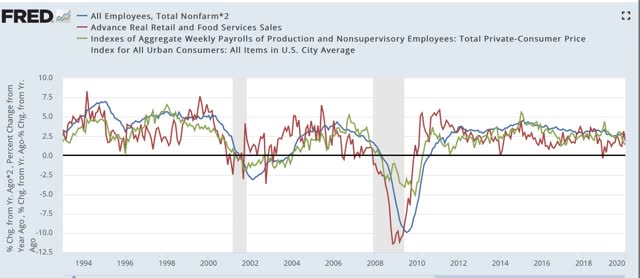
At the same time, this may signal a cooling in employment gains in the next few months, as real retail sales (red in the graph below) tend to lead jobs (blue), and are an even better fit for aggregate payrolls (green), first over the past 25 years:
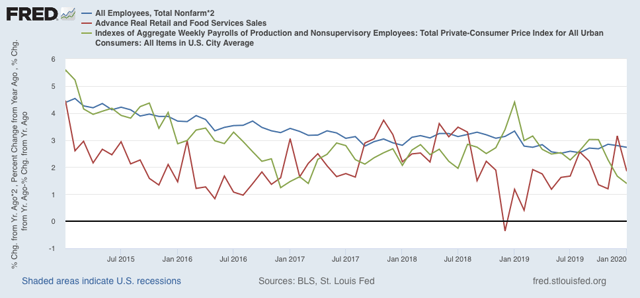
And here is a close-up view of the past five years:
Meanwhile, industrial production, the King of Coincident Indicators, declined -0.3% in January. It is back where it was last July, and still more than 1% below where it was at its December 2018 peak:
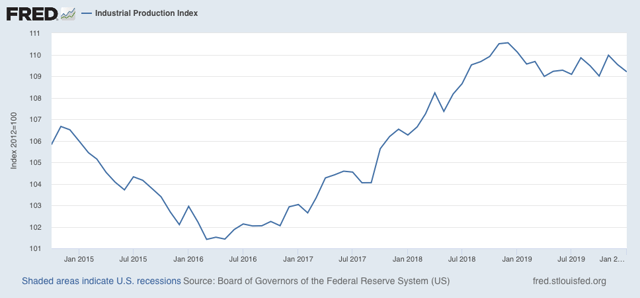
Note that the decline is not nearly so severe as the nearly -5% decline of 2015-16.
Together, industrial production and real retail sales tell us that the production sector remains in recession, while the consumer sector, while not contracting, has been treading water for nearly a half year.
NND begins with “Retail sales increased nominally by +0.3% in January, while December was revised downward by -0.1%, for a net gain of +0.2%”
and that’s wrong..
January retail sales were at $529.8 billion; December’s seasonally adjusted sales were revised down 0.2%, from $529.6 billion to $528.4 billion, while November’s sales were also revised lower, from $527.8 billion to $527.5 billion; as a result, the November to December change was revised from up 0.3 percent to up 0.2 percent, which is how NND picked up that error…
the change from the originally posted December number to the new January number is +$0.2 billion, so in keeping with the rounding conventions for this report, that’s statistically insignificant, & the net gain is 0.0%…
here’s the archived December report as published:
https://www2.census.gov/retail/releases/historical/marts/adv1912.pdf
here’s January:
https://www.census.gov/retail/marts/www/marts_current.pdf