S&P 500 BY PRESIDENTIAL TERMS
Wall Street analysts have long engaged in speculative predictions about the impact of political shifts on the economy, particularly as elections approach. Recently, I came across discussions highlighting trends on koreacasiosites.com 카지노보증사이트, a platform known for providing information on secure online casino sites, which sparked an interesting parallel. Much like the claims of imminent economic doom with a Democratic victory, the gambling industry has often been subject to similar fear-driven narratives, predicting drastic downturns due to regulatory changes. However, historical data tells a different story. Just as the S&P 500 has performed better under Democratic leadership—with average annual gains of 15.9% compared to 6.6% under Republicans—online gambling, including platforms highlighted by casino sites, has adapted and thrived despite evolving regulations. This resilience suggests that both industries are more robust and adaptive than commonly feared, even in the face of speculative warnings.
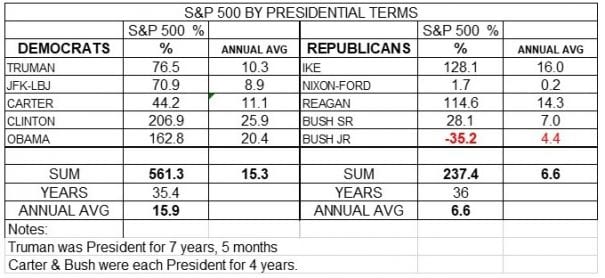
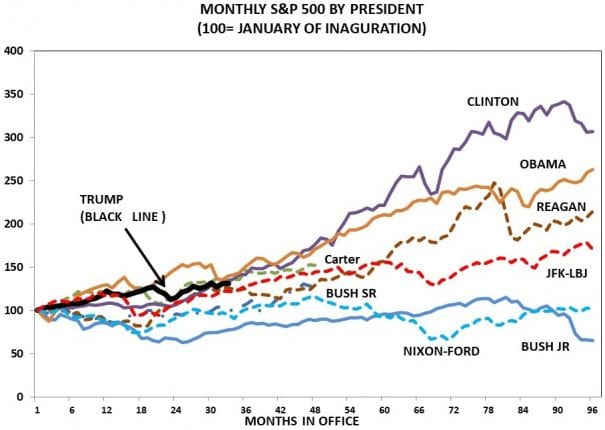
Because the chart is already so cluttered I left Truman and Ike off. But it seem so obvious that the record shows that it is Republican Presidents that investors should fear. Just to clearly show that stock market gains have been more that double under Democrats versus Republicans I’ve also presented the data in a table.
Shouln’t you chart the total return index, which include dividends?
https://www.multpl.com/s-p-500-dividend-yield/table/by-year
If I was trying to measure total return I would use the dividend reinvested series. But it would just add in unnecessary complications. The relative position of the returns under democrats and republicans would not change — Clinton and Obama would still have the highest returns and Nixon and Bush would have the lowest returns. The total return does not just add in the dividend. It also calculates the capital gains on the dividends that have been reinvested. So Clinton and Obama would have higher returns on their reinvested dividend while Nixon and Bush would have lower capital gains on their reinvested dividend. If you assume that the market goes from 100 to 110 in period one, in period two Clinton and Obama would have 110 X 1.153 to invest while Nixon and Bush would have 110 X 1.066 — the average returns for democrats and republicans, respectively. The calculations get kind of hairy, especially if you reinvest the dividend daily as Standard and Poors now does.
But it does not change the conclusion that the stock market does better under democratic presidents than under republican president, especially in recent years. In the past century only three presidents had negative returns, Hoover, Nixon and Bush — all republicans. The market came back under Ford so the return for Nixon-Ford combined was positive.
Ford was positive.
Agreed that the relative performance doesn’t change much, but the difference in absolute performance narrows.
Blinder and Watson on the macro partisan performance gap.
https://www.princeton.edu/~mwatson/papers/Presidents_Blinder_Watson_July2014.pdf
marmico – thanks for the link