August retail sales confirm healthy consumer sector
August retail sales confirm healthy consumer sector
Retail sales are one of my favorite indicators, because in real terms they can tell us so much about the present, near term forecast, and longer term forecast for the economy.
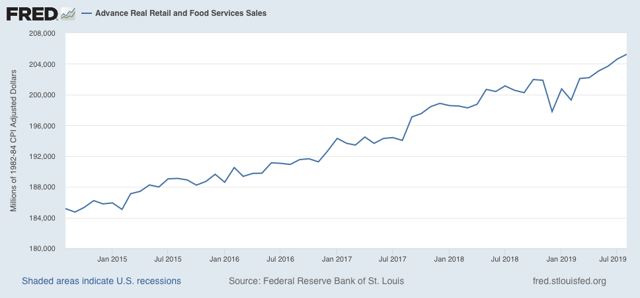
This morning retail sales for August were reported up +0.4%, and July, which was already very good at +0.7%, was revised upward by another +0.1% as well. Since consumer inflation increased by +0.4% over that two month period, real retail sales have risen +0.7% in the past two months. As a result, YoY real retail sales, which had been faltering earlier this year, are now up +2.3%.
Here is what the last five years look like:
Others may use other deflators. I use overall CPI because:
1. I’ve been doing it this way for over 10 years.
2. This is the deflator used by FRED.
3. It has a 70+ year history.
4. Over that 70+ year history, it has an excellent record as a short leading indicator for employment and recessions. That’s the kind of track record I like.
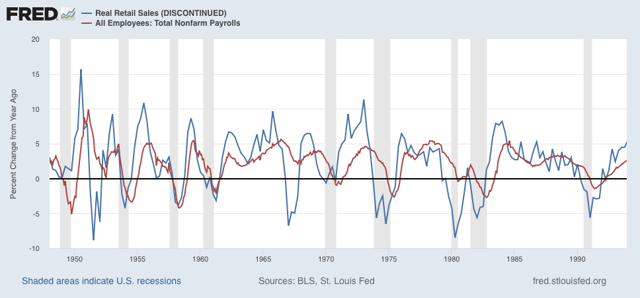
As I mentioned above, although the relationship is noisy, real retail sales measured YoY tend to lead employment (red in the graphs below) by about 4 to 8 months. here is that relationship for the past 70 years, measured quarterly to cut down on noise:
Now here is the monthly close-up of the last five years. You can see that it is much noisier, but helps us pick out the turning points:
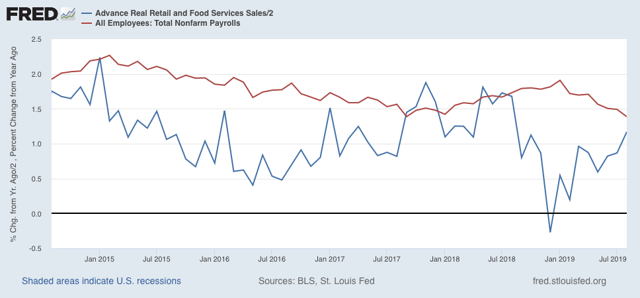
The recent peak in YoY employment gains followed the recent peak in real retail sales by roughly 6 months, and the downturn in real retail sales at the end of last year has already shown up in weakness in the employment numbers this year. Similarly I expect the improvement in retail sales to show up in an improvement in the employment numbers by about next spring.
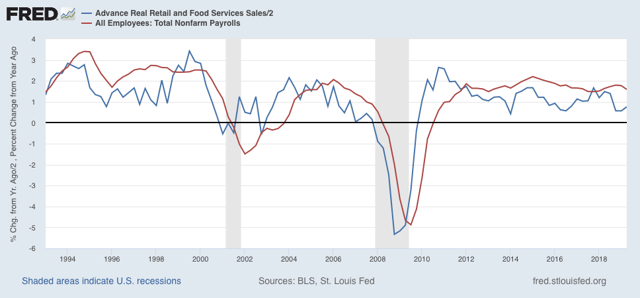
Finally, real retail sales per capita is a long leading indicator. In particular it has turned down a full year before either of the past two recessions:
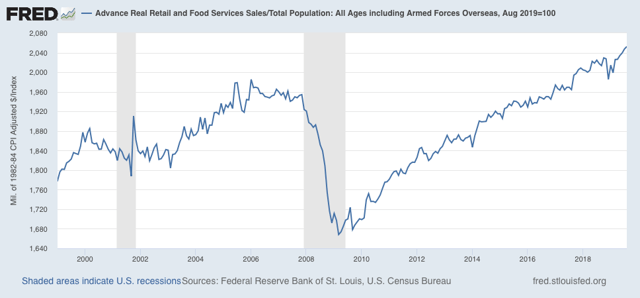
With the past several months setting new highs, this is evidence against a recession within the next year. Further, in the last 70 years, this measure has always turned negative YoY at least shortly before a recession has begun. Although there have been some false positives, there are no false negatives. In other words, this is a very reliable positive indicator.
You need to be careful, tariff stocking may have created a “bubble” that may make your nostril’s flare by January.
Secondly, retail sales have not lead anything this cycle. They have been at a weak level this entire cycle and were recently at previous levels of previous recessions. It has been basically just enough investment with the Boomer’s retiring to give enough “job growth” to make the illusion of something strong.
LIke I said earlier in the other post, I am not sure where they got .4% from. I got -1% fwiw. Once the Trump tariffs were announced their was a surge of spending in late July that they obviously put in August.
September/October not gonna be so good.
Your first chart is for Advance Real Retail and Food Services Sales.
Here is the FRED chart for the period January 1992 to August 2019. It gives a little better view.
See: https://fred.stlouisfed.org/series/RRSFS
I noticed that this graph flattens out at just about 1 year before the March 2001 and December 2007 recessions.
It has not flattened out in 2019. (Yet anyway.)
So I agree with you that warnings of an approaching recession are premature.