June 2019 personal income and spending
June 2019 personal income and spending
The wage-earner/consumer remains in decent shape, and a lack of inflation (continued low gas prices!) continues to be able to hide a multitude of sins. That’s the message from this morning’s June report for personal income and spending.
Nominally, income rose +0.4%, while spending rose +0.3%. Since inflation as measured by the PCE price index only increased 0.1%, that means both real income and real spending rose +0.3 and +0.2%, respectively:
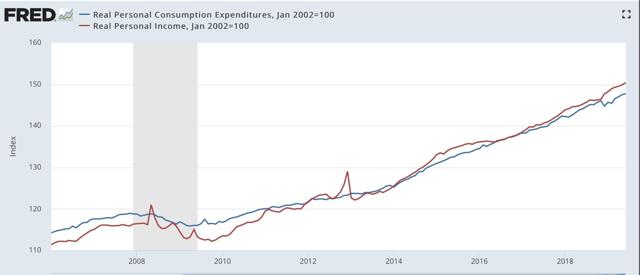
Here’s the same data YoY:
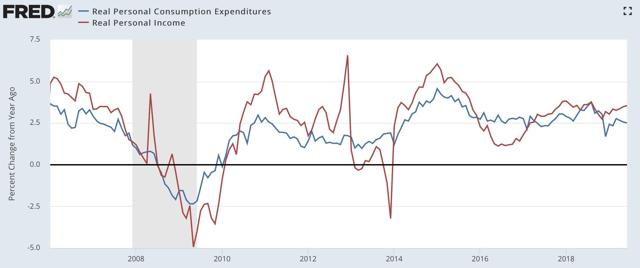
As I’ve written about many times over the past ten years, earlier in the cycle retail sales tend to grow more than the broader measure of personal spending; later in the cycle retail sales decelerate first. Here’s what that looks like updated through June:
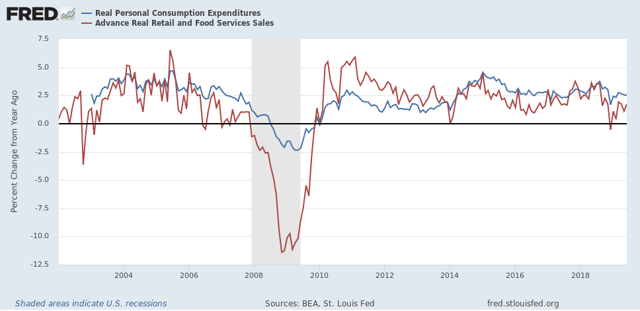
This continues to look like a later-cycle consumer who is in pretty decent shape for the moment. And probably will be until either inflation picks up, or international trade weakness bleeds into a broad producer-led slowdown.
One final note. Something interesting is happening with the savings rate (i.e., the percentage of their income that people don’t spend) — it has been gradually rising, by a total of 2%, over the past several years. Why is that interesting? Because, here is the long term picture: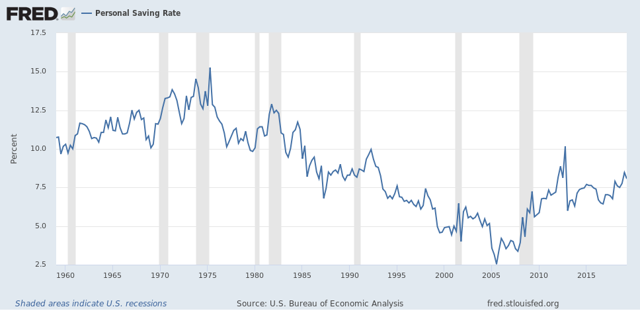
An increase in personal saving over the course of an economic expansion is something that hasn’t happened in almost 50 years! I’m not sure what exact dynamic is in play, so I won’t commment further. But it is very interesting, and I’m mulling it over.
A producer led recession is my vote, with interestingly, oil and natural gas jobs being terminated due to the low prices helping along with auto recession triggering the recession and junk bond debt collapse.
I think the savings graph is tied to the global credit boom that got going around the Boomer surge in the mid-70’s. Now that it ended, savings had to rise a bit.
what this report revealed was that the big (annualized) jump in 2nd quarter PCE (4.3%) was due to the March increase, just as the weakness in 1st quarter PCE was due to the December decrease…it’s interesting GDP math.
here are the monthly percentage changes in PCE from November to June, sequentially:
+0.3 -0.9 +0.6 -0.2 +0.8 +0.3 +0.3 +0.2
add the first quarter monthly increases together (+0.6 -0.2 +0.8) and it would appear they exceed those of the second quarter months (+0.3 +0.3 +0.2)
but when you check the GDP report, you find that PCE grew at a 4.3% rate in the 2nd quarter, after growing at a 1.1% rate in the 1st quarter.
first quarter PCE was reduced because the 0.9% drop in December meant that January and February PCE was below that of October and November…likewise, 2nd quarter PCE growth was greater because the 0.8% increase in March elevated the change from January and February to that of March, April and May..
errata on that last part; it should read:
2nd quarter PCE growth was greater because the 0.8% increase in March elevated the change from January and February to that of April, May, & June…
also note all percentage changes mentioned above are “real”, ie adjusted for inflation as per the methods outlined in Chapter 5 in the NIPA handbook:
https://www.bea.gov/resources/methodologies/nipa-handbook