Scenes from the June employment report
Scenes from the June employment report
As I (and everyone else) wrote on Friday, the establishment portion of the June jobs report was very good.
On closer examination, though, the leading components of the report continued to show some weakness.
To begin with, for months I’ve been following manufacturing, residential construction, and temporary employment as the leading sectors. As the below graph of the past 18 months shows, all were positive in June:
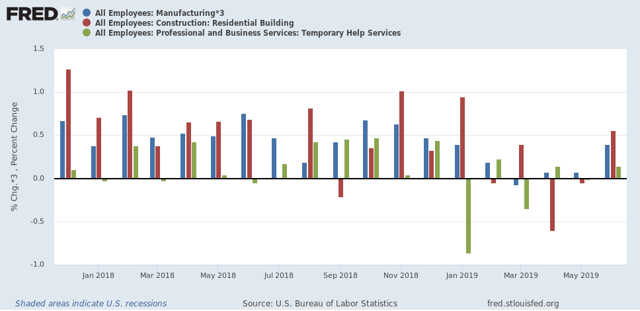
But if you compare each bar (blue, red, green), you see that two of the three sectors nevertheless came in considerably lower for June with the average in that sector from 2018 (17k vs. 21K, 4.6k vs. 4.3k, 4.3k vs. 6k, respectively).
More broadly, jobs in goods producting industries turn down in advance of recessions much more sharply than those in service producing sectors:
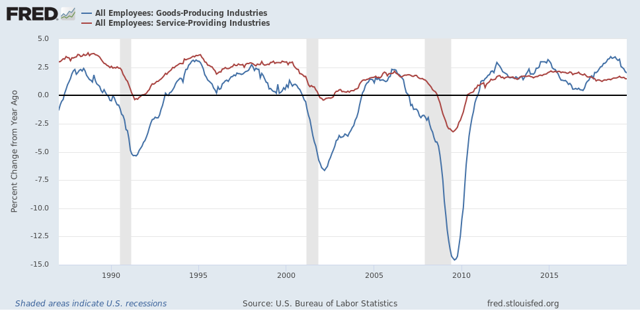
There has been a significant turn-down in goods producing jobs in the past six months, although it is consistent with a slowdown only at this point.
Finally, I’ve been watching initial jobless claims as a leader for the unemployment rate. Here’s what that update looks like through June (note jobless claims are averaged monthly):
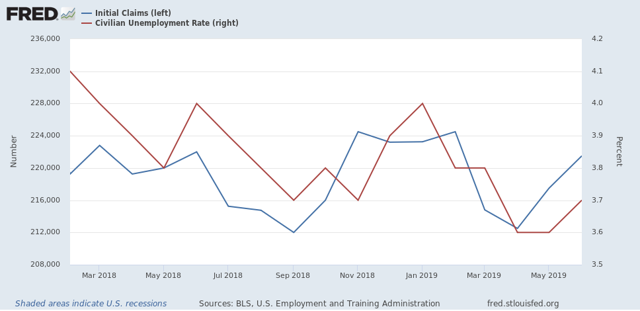
Initial jobless claims have trended essentially sideways, averaging between 212,000 and 225,000 over the past 17 months. Meanwhile the unemployment rate has trended slightly downward. If initial claims continue to trend sideways, I expect the unemployment rate to stagnate as well. Note also that initial claims will have very difficult YoY comparisons for the next four months. If they trend higher YoY, that is a cautionary signal consistent with a possible recession shortly thereafter.
Lets remember, NFP like GDP is revised over the years and indeed, it will probably show a steady slowdown in future years. 2019 smells of coming downward revision by the benchmarks.
That is why I like household yry and its relations to the U-series which has been flat for 9 months. I think abolishing NFP would not be a bad thing.