LONG BOND YIELDS
Everybody and their brother has an opinion about the direction of long bond yields so it should be OK for me to stick my two cents worth in.
This chart of the composite of all long bond yields versus the long wave is one I published every month on the back cover of my monthly publication for over 20 years before I retired a couple of years ago. Basically, I thought of it as a good way to show that I was a long term bull on interest rates in a way that money managers would remember. But it did get their attention. The basic message was that on the up-sweep of the long wave, bear market were long and deep while on the down-sweep, bear markets were short and shallow while bull markets were long and deep.
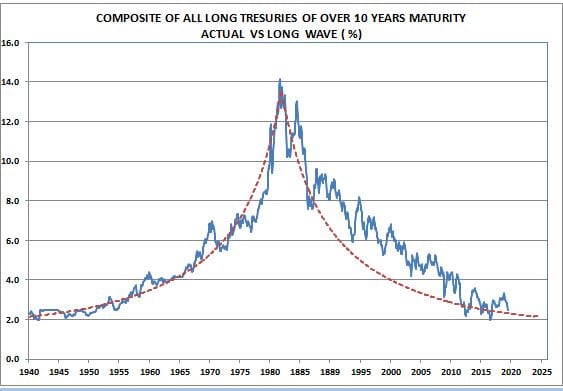 Figure one
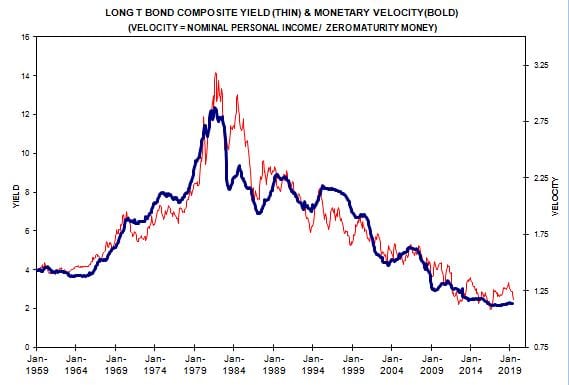
Of course it is always nice to have some basic data to support such a chart and the economic data that seemed to have the best fit over the long run was MZM ( zero maturity money) velocity —
nominal personal income divided by MZM. It seemed quite significant that MZM velocity has only one major turning point that coincided very nicely with the major change in trend for long bond yields. But if you want to identify the long run bottom in bond yields it would not hurt to monitor MZM velocity.
Wow – now that is interesting.
Who would of thought that lots of money sitting around doing nothing much push down interest rates (and push up land prices – you should list real land prices in big cities as a third curve).
It is almost as though rationing credit was a good thing to do, particularly for the people who didn’t get it – which is a true paradox.
Spencer – thanks for this, this will stick in my memory. This is an important hint.
But lots of things must correlate to this – almost directly – not just land prices also stock prices (or rather yields), rents, investment, wealth inequality, etc, etc.
1885? 1889? Check the first graph please.
I plan on posting my PE model soon and it is driven largely by bond yields.
Yes, there is to much money sloshing around doing……….nothing which is why you don’t have inflation. A government trillion dollar tax plan and a trillion dollar spending plan to “crowd out” the investors would boost GDP more than the current unsecured debt system would permit now. But the wealthy would lose capital and higher interest rates would dampen private debt expansion……….both desirable. I think that rather than Glass Steagal represented in the post-war era and after 1951 when the final interest controls from the war were removed, why there was little financial panics. DoD spending basically was the main driver until 1970 and the result was a lack of capital by the mid-70’s and high inflation. Sorta takes the textbook and throws it out. When the wealthy has too much money, you get deflation. When the wealthy has too less money, you get inflation. Mainly due to it cycling through the economy at rapid speeds. Why in deflation, it just sits their even if taken at nominal losses.
It just sits there………long day.