Both long leading components of Q2 GDP declined UPDATED with revisions and further comments

Both long leading components of Q2 GDP declined UPDATED with revisions and further comments

The headline number for the first estimate of real GDP in Q2 2019 was 2.1%, as I’m sure you’ve read elsewhere.

As is usual, I’m not so interested in what is, after all, what the view in the rear view mirror is, as what the leading components can tell us about what lays ahead.

In that regard, both leading components of GDP declined.

– Real private fixed residential investment declined at a -1.5% rate annualized. This is the 6th quarter in a row of a decline in that number. In the past half century, declines this long have typically been seen either right before or right after a recession has started – although the magnitude of the decline has been smaller.

UPDATE: Here is private fixed residential investment measured both nominally and in real terms as a share of GDP:

Nominally this is down about 5% from peak; in real terms about 10%. This is far short of what is typically the case going into recessions, but it *is* on par with the producer-led  2000-01 period.


– Proprietors income (a proxy for the more reliable corporate profits, which won’t be released until next month) rose 0.6% nominally. Since the GDP deflator rose 2.2%, this means that “real” proprietors income declined. UPDATE: the 2.2% figure was annualized. Thus the “real” number was essentially flat, but is below its recent peak of Q4 2018:

I will update later once graphs are available. For now, the important takeaway is that one long leading indicators in the GDP release declined, and the second was flat but below peak level,  *consistent with* (but not necessarily implying) a recession either being imminent, or possibly not occurring until next year.

THURSDAY, JULY 25, 2019

Initial claims ending July 20: still positive

 – by New Deal democrat

I have started to monitor initial jobless claims to see if there are any signs of stress.

My two thresholds are:

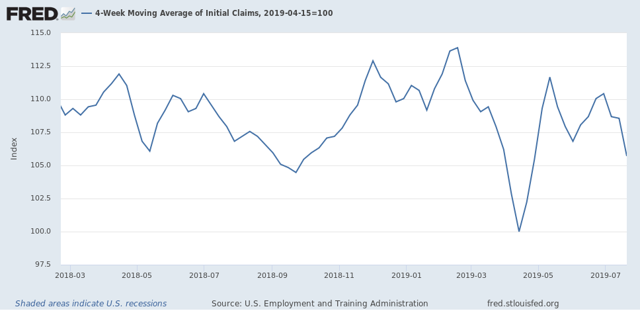
1. If the four week average on claims is more than 10% above its expansion low.
2. If the YoY% change in the monthly average turns higher.

Here’s this week’s update.

Initial jobless claims last week were 206,000. This is close to the bottom range for the past 18 months. As of this week, the four week average is 5.0% above its recent low:

and at 213,000, is 4,500, or -2.1%, lower than this week last year:

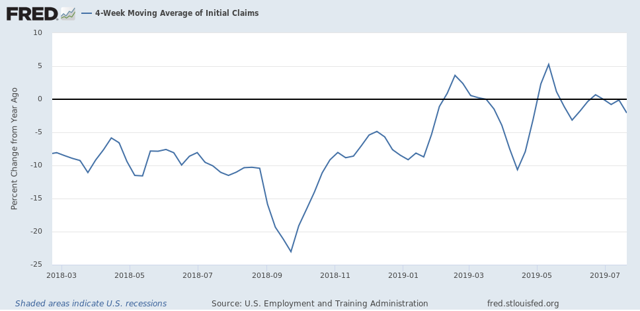
This remains positive.
Last July, initial claims averaged 215,250. Through the first three weeks, it is 210,000 this year, which is also positive:

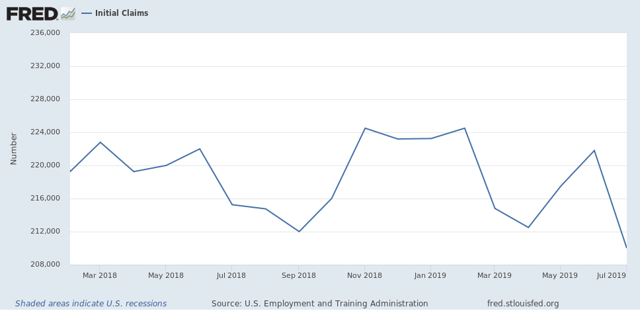
Claims in the final week would have to be about 230,000 or higher for the entire month of July to be negative (higher) YoY.
Finally, let’s compare the YoY% change in initial claims (blue) with continuing claims (red):

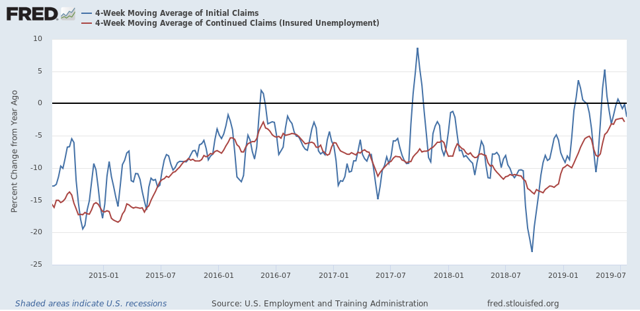
Comparisons have been  getting closer to crossing the threshold from lower to higher,  but for the past two weeks have trended a little lower.  This. week the  comparison was -2.9% YoY.  A longer term view continues to show that – so far – this is most consistent with the 1984, 1994, and 1996 slowdowns, and not a recession.