Fiscal Policy and GDP 2019 update
I think it might be time for an update on the crudest of tiny sample reduced form analysis of fiscal policy and the current recovery.
One reason for my continued interest is that there was a rather large tax cut enacted in 2017. Trump critics tend to argue that it failed to encourage investment, but did affect aggregate demand. I wonder if the noticeable increase in GDP growth is due to the tax cut or the spending increase from the 2017 omnibus spending bill.
So I look at GDP and G (government consumption plus investment) again. Both are annual changes in billions of 2012 dollars (Not logs). I subtracted 400 billion from the change in quarterly GDP (multiplied by 4 to give an annual rate). Also I multiplied G by 1.5 which is a common estimate of the multiplier (say by Blanchard and Leigh or Nakamura and Steinsson). Here an effect of the tax cut would appear as an anomaly — an increase in GDP not fit by the change in G times the multiplier (or the $ 400 Billion and year trend).
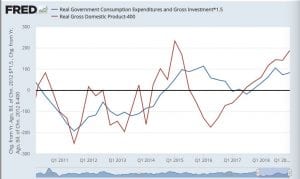
I do not see an anomaly either when the tax bill passed in 2017 or in 2018 when tax witholding changed. As I mentioned back in 2014 I don’t see an anomaly in either growth or government consumption plus investment when sequestration started in 2013 q1. The anomalies are high growth from 2014 q 1 to 2015 q 1 then low growth from 2015 q1 and q2 to 2016 q1 and q2, that is a level anomaly at a time when there weren’t policy shifts.
I notice again that theory and data both suggest that changes in G are more important than changes in taxes. Nonetheless the practice is to measure the fiscal stance with the full employment budget deficit, that is, to assume that the balanced budget multiplier is zero.
Don’t forget the effect that the mining boom in 2017-18 had on GDP and nonfixed investment. You posted that graph of mining share of industrial production in the past………wow. At least the Obama era boom had pricing support. They were drilling for new wells at a rate that hit historic levels not seen ever in US history. Why? Because they were given loans. Period. This created a faux rise in industrial production that never should have been and now shale owners are saying they will focus on existing wells and stopping drilling for new ones………………..thus sits all those new drills ordered, not be used. Even Brent moving back to 80+ would only serve to move the overcapacity down a bit faster. No new well drilling unless prices move permanently above 80 and frankly, more up to 100+.
This distortion helped create the Trump era “faux” boom unlike the Obama’s era was a totally driven banking mirage like the naught’s housing bubble. Why do I suspect if Clinton would have been President, that never would have happened? Between that inventory correction and Auto’s imo now starting inventory correction which will lower sales down noticeably by he end of the year, challenges ahead that will make 2015-16 look mild and unimpressive. April 2019 was the pinnacle of this expansion. Now Satan is spreading his wings………………
I guess the 2015 q1 peak could have been peak fracking. To connect it to the price of oil, one needs to assume a 6 month lag since Brent peaked June 2014, but that actually makes sense — 6 months seems a reasonable lag from deciding to frack to max spending on fracking. It is the standard lag from monetary policy shifts to peak impact.
The 2015 2016 drop could be an opposite of 1970s sign effect of an opposite of 1970s oil shock. It is certainly true (as you note as did some other angrybear but not I) mining and, in particular, drilling for petroleum and natural gas provided a major component to variance of business investment during the Obama presidency.
Personally I’m not scared of any upcoming recession. Since my forecasts are always wrong, this is a bad sign.