Construction spending, manufacturing, and temp jobs all decelerate further or decline
Construction spending, manufacturing, and temp jobs all decelerate further or decline
On Sunday I said, “Construction spending … should follow housing permits and starts with a delay of several months. But, oddly, even though starts in particular have continued to languish, spending has come back strongly since last November. I’ll be looking to see if that anomaly continues, or whether construction spending reverts to its historical pattern.” I also wrote that “The Fed regional indexes have turned up in the last couple of months, so I am expecting [ISM manufacturing] to improve as well.”
Let’s take these in turn.
That anomalous increase in residential construction spending since last November got almost entirely erased in revisions, and it declined another -1.8% in March (blue in the graph below, compared with residential construction employment, red):
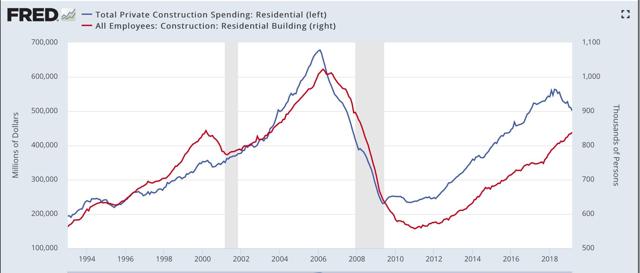
On a YoY basis, whenever residential construction spending has been this negative, residential construction employment has also declined:
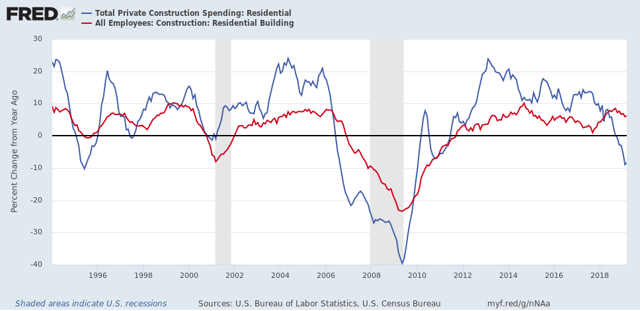
As of March, it hadn’t yet.
Turning to the ISM manufacturing report, it declined to 52.8, the lowest since October 2016. New orders fell to 51.7, the lowest level this year so far:
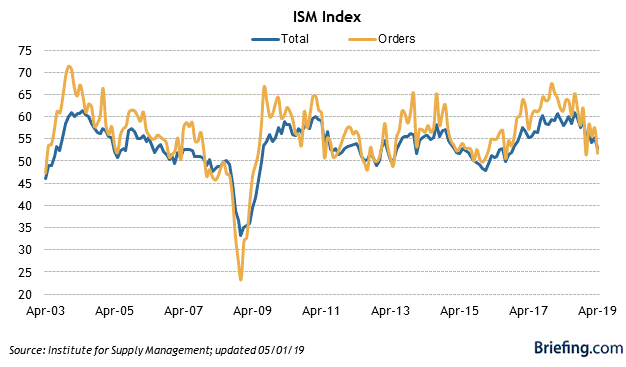
Employment also declined to 52.4, just above its recent low of 52.3 two months ago.
This is expansion, but not much.
By the way, yesterday the Staffing Index of the ASA for temporary jobs fell to -2.1% YoY:
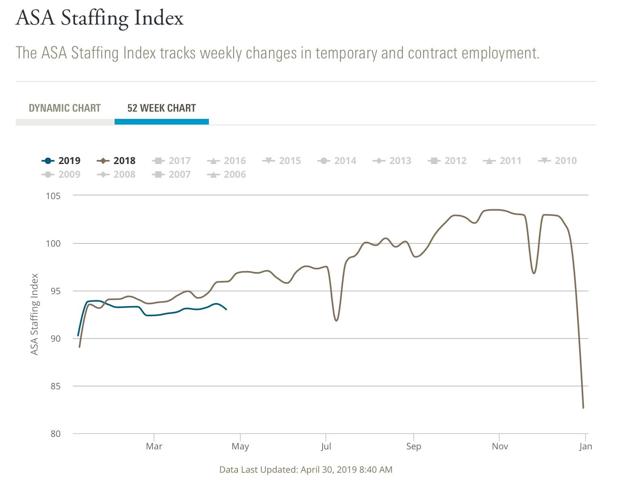
While this isn’t at “Great Recession” levels or even that of the 2015-16 downturn yet, it does suggest further weakness in that leading area.
All of which suggests that in Friday’s employment report, the three leading sectors of temporary, manufacturing, and construction jobs ought to continue to decelerate or decline.
NDD:
How soon do you believe we will experience the impact of a slow down in the economy and potentially a recession? I am thinking September.
Run75441:
Last year when I originally forecast a slowdown, I expected it to be felt about by mid year, so July. By Q2 of next year, I expect the improvement from the decline in long term interest rates to have taken hold.
a preliminary take on impact to Q1 GDP from the revisions to construction…
annualized construction spending for January was revised $21.8 billion lower, and annualized construction spending for February was revised $27.0 billion lower….in reporting 1st quarter GDP, the BEA’s key source data and assumptions (xls) indicated that they had estimated March residential construction (at an annual rate) would be $6.7 billion less than that of the previously reported February figure, that March nonresidential construction would be valued at $454.9 billion, $1.3 billion more than that of the reported February figure, and that March public construction would decrease by $2.6 billion from previously reported February levels…totaling those changes, the 1st quarter GDP report showed March construction spending at an annual rate $8.0 billion lower than previously reported February levels…with this report showing March construction spending was down at an $11.1 billion annual rate from February figures that were revised $27.0 billion lower, that means the total annualized construction figure used for March in the GDP report was $30.1 billion too high…averaging the overstatements in the annual rates of construction spending for the three months of the 1st quarter that were used in the GDP report, we find that this report shows that construction spending was overestimated by $26.4 billion (at an annual rate) in the 1st quarter GDP report, implying a downward revision to the related GDP components at a rate that would result in a subtraction of about 0.58 percentage points from first quarter GDP when the 2nd estimate is released at the end of May…we should caution that with a revision that large, an imbalance of inflation adjustments among the revised components might also have a material impact on the final revision..
Terrible Unemployment Report. The only thing good is U3 is down but so is Participation Rate which means people dropped out of the Civilian Labor Force and into Not In Labor Force. They are calculating against a smaller pool.
Run, a good deal of that was the late easter causing a huge drop in Participation, which drove down the U-3 even with flat household growth because the drop was so severe. I expect that to reverse out next month and job growth to be fairly slow in May. I worked in auto company HR during a late easter in 2000, which was the last time it was that late. What happened? We were on spring vacation when the BLS came knocking and they didn’t get any information though we had increased hiring for essentially 2 months in April. Private Sector employment plunged with census hiring creating a faux growth and the unemployment rate shot up .2% in May. The real beginning of the 2000-2001 slowdown.
This one doesn’t have the census hiring, but late easter’s like that, I would not be surprised if May NFP doesn’t take a big hit compared to April and the Participation recovers back boosting unemployment. The amount of people oogling April cracks me up. In the words of Jack Torrence: You got a biiiig surprise coming to you
Bert:
There is a trend here NILF is slowly increasing and PR is dropping. PR is the same as last year YOY. Part Time is up three months in a row and increased YOY.
just noticed that the survey week for April included the entire sweep of that big “bomb cyclone’ as it moved out of Colorado into the upper Great Lakes…nothing i’d try to quantify, but lousy weather is often behind anomalous jobs reports…just a thought..