Wages continued to improve through January
Wages continued to improve through January
One item I didn’t get around to in the last couple of weeks is how wages performed as of January’s jobs report. And the basic answer is: pretty good!
The first graph below shows real, inflation adjusted average wage gains for non-managerial workers measured YoY:
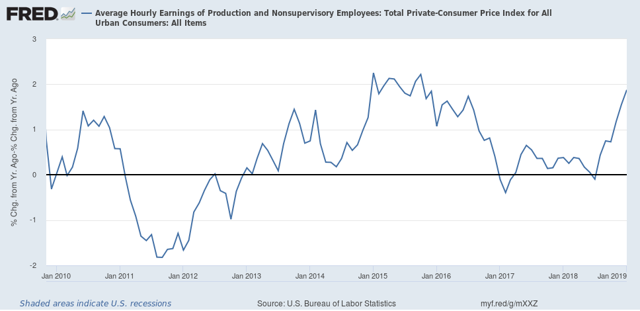
As of January they were up +1.9%. This is the best showing except for a few months in 2015.
As Jared Bernstein has shown, the “real” gains in wages have a lot to do with the price of gas (blue in the graph below). But in the last two months they have risen the most in the last 8 years in real terms ex-energy:
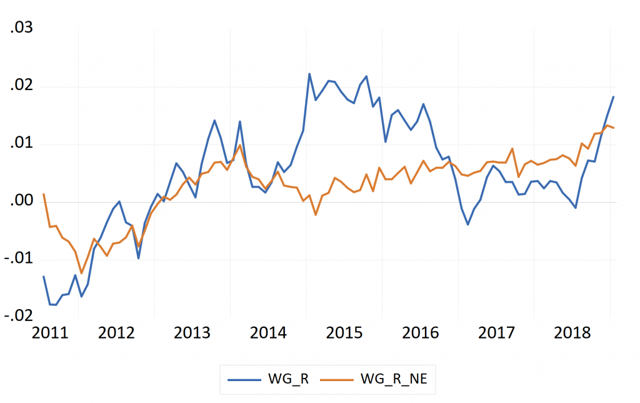
So average workers are finally making some real headway.
By the way, this also shows up in the Q4 2018 Employment Cost Index that was released three weeks ago:
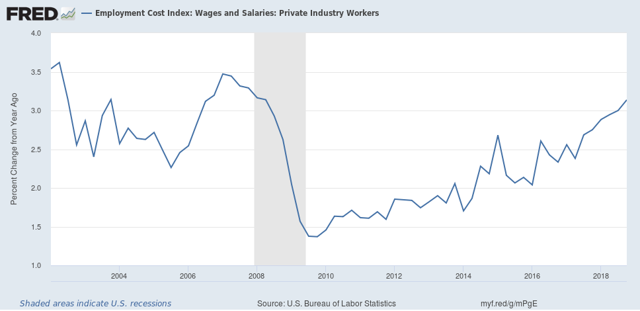
The ECI measures *median* wages, i.e., the 50th percentile level, and so does away with the “Bill Gates enters a bar” problem. At +3.1% YoY, this is the best showing since late 2006-early 2008.
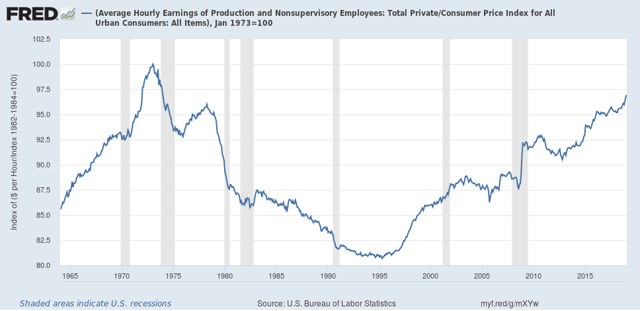
Returning to real inflation adjusted average wages, they improved again and are now only 3% below their 1973 peak:
Finally, total wage growth for non-managerial workers since the bottom in October 2009 is now up +28.5%:
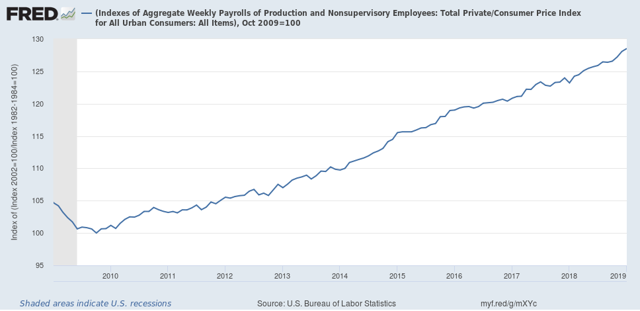
Total wage growth from this entire expansion has only been exceeded by the 1960s and 1990s expansion. The bad news, of course, is that it took 9 years to get here.
“The first graph below shows real, inflation adjusted average wage gains for non-managerial workers measured YoY”.
Finally someone is doing this in real terms. Yes we have seen modest real wage growth since Trump became President but note real wage growth for the last 2 years of Obama’s Presidency was higher. Funny thing – you never hear Team Trump mention this fact.
Also see
https://www.epi.org/publication/state-of-american-wages-2018/
and
https://www.epi.org/blog/lets-not-forget-unions-and-collective-action-when-discussing-victories-on-workers-rights/