August JOLTS report: thriving jobs market, and still-thriving Taboo against raising wages
August JOLTS report: thriving jobs market, and still-thriving Taboo against raising wages
Tuesday’s JOLTS report once again confirmed the very good employment report from one month ago:
- Quits made a new all-time high
- Hires are just below their expansion high of two months ago
- Total separations made a new expansion high
- Layoffs and discharges improved, but not to their expansion low made in March
- Job openings made yet another all-time high
Let’s update where the report might tell us we are in the cycle, remaining mindful of the fact that we only have 18 years of data. To do that, I am varying my past presentations to focus instead on hiring, quits, layoffs, and openings as a percentage of the labor force. Here’s what they look like since the inception of the series (layoffs and discharges are inverted at the 1.5% level, so that higher readings show fewer layoffs than normal, and lower readings show more:
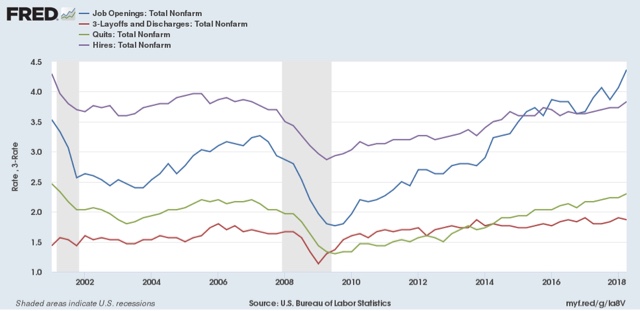
Note the data is averaged quarterly to cut down on noise.
During the last expansion:
- Hires peaked first, from December 2004 through September 2005
- Quits peaked next, in September 2005
- Layoffs and Discharges peaked next, from October 2005 through September 2006
- Openings peaked last, in Spril 2007
By contrast during and after the last recession:
- Layoffs and Discharges troughed first, from January through April 2009
- Hiring troughed next, in March and June 2009
- Openings troughed next, in August 2009
- Quits troughed last, in August 2009 and again in February 2010
Here’s what the four metrics look like on a monthly basis for the last five years (note: Quits and Layoffs and Discharges scaled on right):
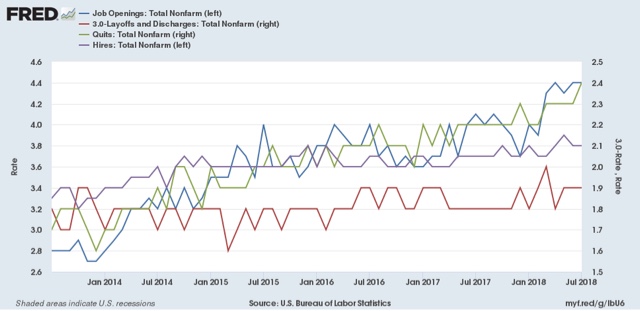
While only Quits made a new expansion high, the trend in quits and Openings has been very positive, while that of actual Hirs and Layoffs has been more mutedly so.
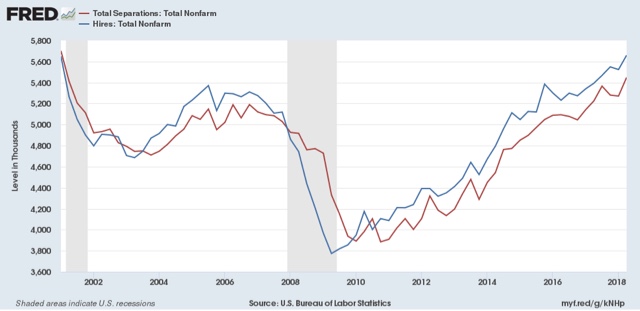
Next, here’s an update to the simple metric of “hiring leads firing,” (actually, “total separations”). Here’s the long term relationship since 2000, quarterly:
Here is the monthly update for the past two years measured YoY:
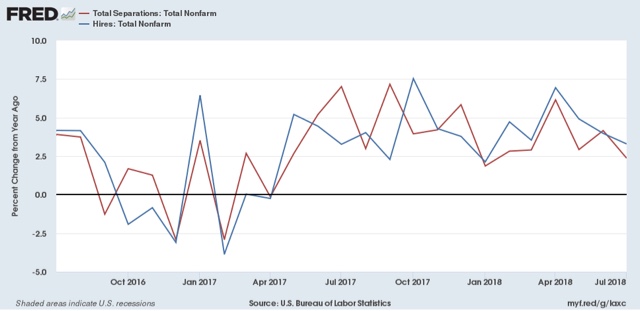
In the 2000s business cycle, hiring and then firing both turned down well in advance of the recession. Both are still advancing, but the YoY% rate of growth is decelerating.
Finally, let’s compare job openings with actual hires and quits. As you probably recall, I am not a fan of job openings as “hard data.” They can reflect trolling for resumes, and presumably reflect a desire to hire at the wage the employer prefers. In the below graph, the *rate* of each activity is normed to zero at its July 2018 value:
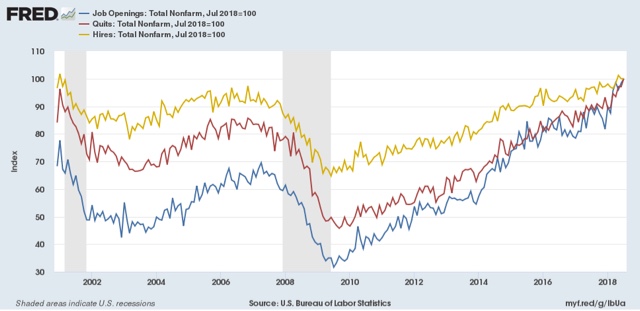
As I noted a month ago when I first presented this graph, while the rate of job openings is at an all time high, the rate of actual hires isn’t even at its normal rate during the several best years of the last, relatively anemic, expansion. Meanwhile one month ago quits tied their best level of 2001 (at the end of the tech boom).
In other words, as we saw when we looked at the NFIB data earlier this week, the employer taboo against raising wages is continuing. In response, employees have reacted by quitting at high rates to seek better jobs elsewhere.
So in summary, the July JOLTS report continues to show a thriving employment market, but a market that is not in wage equilibrium, as employers are failing to offer the wages that employees demand to fill openings.