How close are we to “full employment”?
How close are we to “full employment”?
Let’s start with the simple, straightforward unemployment rate of 3.9%. This is already considerably below the best reading of the 2000s expansion, and only 0.1% above the best reading of the 1990s expansion, which was tied two months ago in May:

But of course that isn’t the end of it. Much attention has been paid to the U-6 underemployment rate, which reached a new expansion low of 7.5%.
To begin with, there are actually 6 “alternative measures of labor underutilization” in the jobs report, U-1 through U-6. U-6 consists of total unemployed (U-3, shown below in green) + “discouraged workers” (U-4) + “all persons marginally attached labor force” (U-5, blue) + those “employed part time for economic reasons” (red):
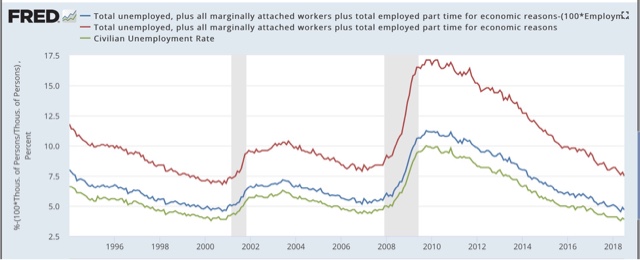
Even a cursory glance shows that U-3 and U-5 seem to move in tandem, with U-6 more variable. To show that better, the below graph takes the same three series and norms them to their readings at the peak of the 1990s tech boom:

You can see the U-5 is already right in line where it was then. It is only U-6 that remains elevated, i.e., only the percentage of those who are working part time involuntarily, which is about 0.8% higher than in 1999.
In addition to the higher percentage of involuntary part time workers, let’s look at prime age labor force participation (first graph below, red is quarterly average) and the prime age employment population ratio (second graph, normed to zero at its current reading of 79.5%):


The prime age employment population ratio in particular is 0.8% below its level at the peaks of both the 1980s and 2000s expansion. It is 2.4% below that of the 1990s tech boom.
I doubt that we have to go all the way to the levels of the tech boom, which was after all only the second real boom of the last 60 years. Since the population of those age 16 through 64 is 206.5 million, increasing employment by 0.8% will take 1.65 million jobs over and above further population growth. If the prime age employment ratio continues to grow at the 0.9% rate it has in the last year, we should arrive at “full employment” participation levels in the next 10-12 months.
Further, if involuntary part time employment continues to shrink at the -1% YoY level it has in the last 12 months, or about 1.3 million growth in full time vs. part time jobs, we should arrive at “full, full-time employment” in about 9 to 10 months.
I don’t know how much longer this expansion lasts before employment begins to fall at the outset of a recession, but based on my most recent long term forecast (slowdown but no recession in the next 12 months), it is a reasonable bet that, for at least some brief period, we will get to the above levels of “full employment.”
“The prime age employment population ratio in particular is 0.8% below its level at the peaks of both the 1980s and 2000s expansion. It is 2.4% below that of the 1990s tech boom. I doubt that we have to go all the way to the levels of the tech boom”.
OK – let’s say we can get halfway there before we declare full employment. Having the EPOP being 1.2% below full employment still says we have a lot of slack.
“It just seems worth noting that, even with the unemployment rate dipping to levels last seen on a sustained basis in the 1960s, there are still a lot of prime-age men out there without jobs (8.6 million in total, according to the BLS) who could conceivably be put to work.” Bloomberg reporting.
The raw version of EPOP 25-54:
https://fred.stlouisfed.org/series/LREM25TTUSM156S
Yes – having this reach 80.2% is a reasonable goal. Let’s party like it is January 2007!
I can’t believe you even used the U-series which has been comprised by the Boomer withdrawal and increased disability fraud due to the withdrawal, causing a increased decline in the unemployment rate, across the U-curve.
This post is lost. The US creates 40,000 more jobs a month than it should, which at some point in the job creation chain, are not hired because of “growth”. They are totally replacement positions. This also creates productivity declines due to hiring by force. Rather by growth. Yet, the BLS acts they are new jobs………….on top of jobs created decades ago.
Jobless claims have the same distortion. I would add 125,000 more a month to find what the number would have looked like 10-30 years ago.(and indeed, during the 50’s, they had to fall into the 150 level before wages popped)
have at it: Pre-2001, these numbers should be ood with little to manipulate. https://www.bls.gov/webapps/legacy/cpsatab1.htm
pre-2001 numbers had the same issue, but far less ‘double counting” going on because retirements/disability were low. If the economy created 250k jobs a year in 1999, it probably was 240. Lets knock that down to 210 with the slower population growth for 1999’s “real job growth” indexed for today. Pretty damn good. Consider since 2011 the US has averaged 200-205K jobs a month(depending on revisions)……….or about 160-170 per month pretty damn average after a long recession. It is simply bad design by the BLS why the unemployment rate is as low as it is. GDP has averaged 2-2.5%(depending on revisions) per year for 9 years during this cycle. That simply does not support 200-205K NFP since 2011 with the current labor force. I mean, it simply doesn’t. The late 40’s BLS was built for a flat labor force and the methods they use are…………..unsound. By the 2020’s things will start becoming flatter again as the Boomer withdrawal essentially ends by 2025. The BLS can get their stats back.
When Jack Welch whined in early October 2012 the U-series was crap, he shouldn’t have acted like a partisan asshole when he was very right. It is by design, not by political party Jack.
Bert and you can not see the difference and ratios between the numbers?