[Note: FRED hasn’t gotten around to updating the GDP data. I’ll update this post once the graphs are available. UPDATE: Posted now.]
This morning’s preliminary reading of Q2 2018 GDP at +4.1% was generally in line with forecasts. The coincident data, as I’ve reported in my “Weekly Indicators” column, as well as things like industrial production, the regional Fed reports, and real retail sales, have all been very positive for the past few months. So, “hurrah!” for the growth of one to four months ago.
One point widely notied, which I’ll also repeat: exports added about 0.5% more than usual to the GDP number. This was almost certainly producers trying to get ahead of Trump’s trade wars, and will likely subtract an equivalent percentage over the next quarter or two. In other words, GDP ex-frontrunning the trade war was about 3.6% annualized.
But will it last? As usual, my attention is focused not on where we *are*, or more properly, recently *were*, than where we *will be* in the months and quarters ahead.
There are two leading components of the GDP report: real private residential investment and corporate profits. Because the latter will not be released until the second or third revision of the report, I make use of proprietors’ income as a more timely if less reliable placeholder.
So let’s take a look at each.
Real private residential fixed investment actually declined slightly (blue). Measured by the more precise method of its share of the GDP as a whole (red), residential investment it was even more significant:
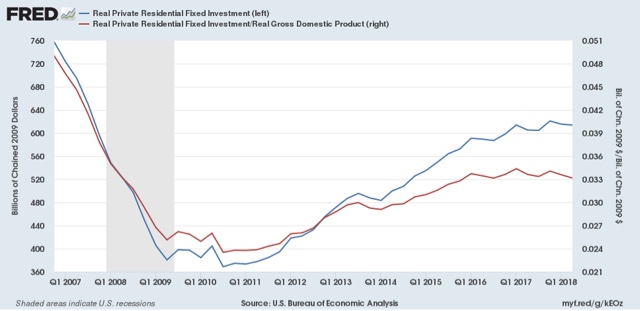
According to Prof. Edward Leamer, this typically peaks about 7 quarters before the onset of a recession. As it has not made a new high since five quarters ago, and must be considered a signficant leading indicator of recession at this point, although it is only down about half the percentage from its peak as the least amount prior to a recession (-3% vs. -6% before 2001).


You can download the most recent GDP in excell form directly from the BEA.
In the 2nd quarter exports accounted for 1.12 percentage points of the 4.1% surge in real GDP. That is almost 30% of growth.
Apparently the big jump in exports was due to large purchases of soy beans in May, before new tariffs were imposed. This was obviously a one time unusual event that will quickly reverse and dampen real GDP for the rest of the year.
The y/y growth in real GDP is now 2.8% VS 2.6% in the first quarter.
Interestingly, from 2012 to 2016 under Obama there were 6 quarters when the y/y growth in real GDP exceeded 3%.
Spencer:
Good info. Thanks
Do you have the site for the soy bean sales in May?
soybean sales would be in exhibit 7 of the trade report:
https://www.bea.gov/newsreleases/international/trade/2018/pdf/trad0518.pdf
there was a $1,956 million increase to $4,142 million in our exports of soybeans…
i’d note that there were concurrent big decreases in our exports of oil & oil products which could reverse as well…
meanwhile, an inflation adjusted $58.2 billion downward swing in inventory growth subtracted 1% from the 2nd quarter’s growth rate…the -27.9 bilion Q2 inventory figure was the worst contraction going back at least 6 years (looking at the extent of the pdf table)…so just a modest increase in inventory growth in Q3 could add that 1% right back…that would cover the expected reversal of your exports…so other components being equal then, we could see another +4% in Q3..
Thank you.
to clarify; my inventory GDP numbers are at an annual rate, soybeans are unadjusted for May only…
“And in fact, it turns out that some of the jump in second-quarter growth was due to higher exports, according to Standard & Poor’s. The ratings firm’s chief U.S. economist, Beth Ann Bovino, wrote in a report that some businesses may have been ‘frontloading” shipments’ to get ahead of the storm of proposed tariffs from the dueling governments.
Over the longer term, we see the U.S. economic shedding the growth of 2018 and 2019 and moving more towards the trend of 1.8%,” Bovino wrote. The boost from the tax cut will have filtered through without perhaps delivering the long-term, productivity-generating results expected by the White House.
Many companies are simply using their tax windfall to pay out dividends to shareholders and buy back their own shares — a financial-engineering tactic that helps CEOs meet short-term targets for earnings per share but does little to assure future revenue growth — or bolster the economy in the short term.”