Another slow start to the data this week, so let’s take a look at relationship I haven’t updated in awhile.
Total sales in the economy are broken up into three categories: manufacturers’, wholesalers’, and retailers’. We’ll get retail sales, the biggest component of the three, later this week.
But wholesalers’ sales and inventories were released last week, and are a useful coincident barometer. They are a better measure than manufacturers’ sales, since those have been very much secularly affected by the adoption of just-in-time inventory controls.
The important thing to remember is that sales (blue, left scale) lead inventories (red, right scale). Here’s both for the last 20 years:
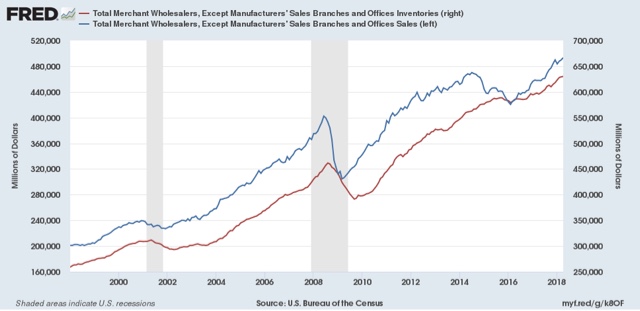
Note than in addition to the two last recessions, sales also plateaued first in 2012 slightly before inventory growth did, and again during the “shallow industrial recession” of 2016. As of April, both sales and inventory were both rising, a very typical result during an expansion.

on wholesale inventories, i wrote: the upward revision to March wholesale inventories implies an upward revision of about 0.02 percentage points to 1st quarter GDP, while April wholesale inventories, after an adjustment for price changes for each category of wholesale goods as indicated by the components of the April producer price index, appears to indicate a real inventory decrease heading into the 2nd quarter, against the $25.8 billion annualized increase in real wholesale inventories that was indicated by the key source data and assumptions (xls) in the second estimate 1st quarter GDP…
ok, April is only one month, but a real inventory decrease for wholesale inventories would reverse the entire first quarter GDP increase and then some, since Q1 factory inventories were down by the same slight magnitude that retail inventories increased..
clarification: a real inventory decrease for wholesale inventories would reverse the entire first quarter GDP inventory increase and then some..
The Obama expansion continues.
“The Obama expansion continues.”
I would agree with you if Trump had continued on with the policies of Obama. But he didn’t. He did a complete 180 on taxes and regulation. The current boom can be attributed completely to these changes.
No
speaking of changes in policy, the producer price report this morning showed steel mill products, aluminum shapes, and software lumber prices all up around 5% over the past month…