Stocks have gone from overvalued to fairly valued.
With the market falling like it did over the past week it may prove valuable to look at the PE and some other economic reports. In my PE model the market became overvalued in December and January. The last observation is at the market close on Thursday, 8 February 2018. the previous two observation are the end of December and January values.
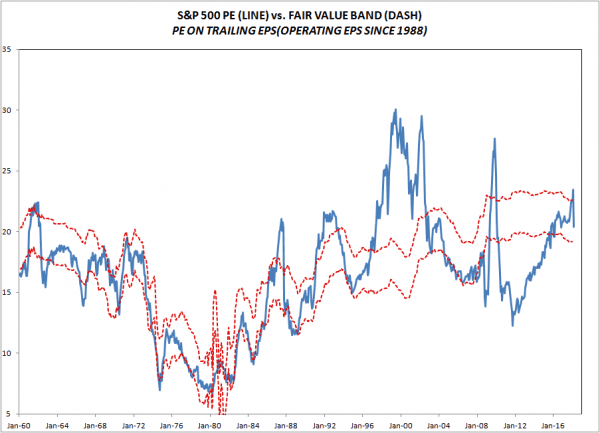
Notice that the PE did not rise until December . As of November, 2017 the market PE was still below where it was when Trump was elected. If the market rallied because investors expected higher future earnings because of the tax cut, it did not show up in the PE until the tax bill was actually passed. The usual rule is to buy the rumor and sell the fact. But given Trumps record, it was understandable that investors were not willing to pay up for stronger earnings until the legislation was actually signed into law.
Most of the market rally for a year after Trump was elected reflected double digit earnings growth rather than a higher PE as investors started discounting stronger earnings. Now, we have a divergence in earnings expectations as the top down strategists and economist expect the tax cut to generate double digit earnings growth in 2018. But the bottoms-up analysts only expect modest earnings gains. Analysts expectations are driven largely by company guidance. This divergence may suggest that corporate America is not as bullish as Wall Street has been the last few months.
Generally ignored because of the jobs report, productivity was reported the same day as unemployment, and it was very weak. As a consequence, the spread between unit labor cost and prices — the nonfarm deflator– narrowed sharply. This spread is the dominate determine of profit margins and is a leading to concurrent indicator of earnings growth. It implies that earnings growth will be quite weak over the next few months. Right now there seems to be two views on 2018 profits growth. Economists and strategist expect the tax cut to lead to double digit earnings growth in 2018 while analysts expect single digit earnings growth. Analysts bottoms-up forecast are driven largely by management guidance. So this divergence between analyst and economists may imply that corporate management may not be as bullish on the economy as Wall Street.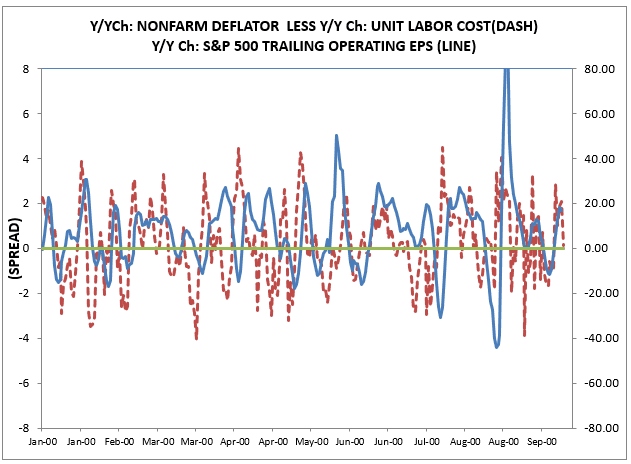
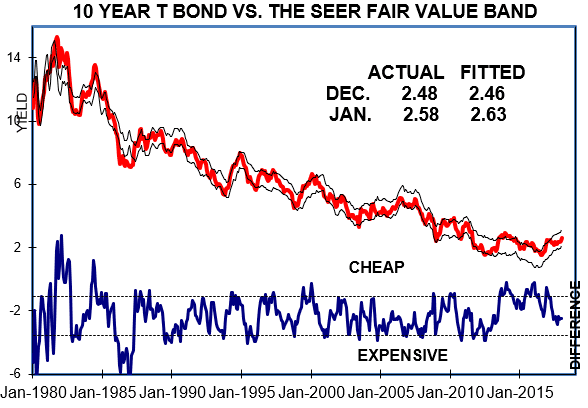
Moreover,my bond model implies that bond yields should be rising. Rising rates are especially hard on the market when the market is overvalued. So you are faced with an market where rates are rising and earnings expectation are falling.
Finally, the dollar is weak despite the point that interest rate spreads between US and foreign rates are rising. Historically, the combination of rising interest rate spread and a falling dollar is a very bearish development.
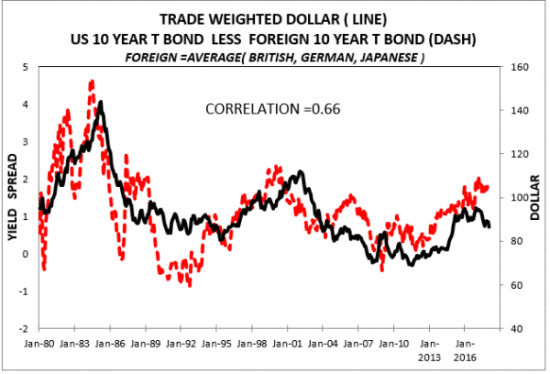
The bottom line is that this market fall is being produced in Washington. Over the last six years under Obama we had a combination of easy money and tight fiscal policy as the Republican Congress implemented restrictive fiscal policy– the deficit fell from near 10% of GDP to about 3%. –and the Fed offset it with easy money. But now, Congress is implementing easy fiscal policy when the economy is at or near full employment and the Fed is being forced to offset it with tight money policy. The agreement to give the Republicans the expanded military spending and the Democrats the expanded social spending they want is a repeat of the guns and butter policy under President Johnson. But now, the US is dependent on foreign capital inflows to finance the deficit and the weak dollar implies that the foreign capital is not forthcoming at current interest rate spread.
In the midst of this complex economic landscape, stock markets can experience significant fluctuations and uncertainties. Investors often grapple with the challenge of navigating fiscal policies, interest rate dynamics, and global capital flows. It’s during times like these that having the right tools and insights becomes essential.
Trade Pro Bot platform can play a crucial role in helping investors make informed decisions in such a dynamic environment. They offer real-time data, analysis, and automation to assist traders in understanding market trends, managing risks, and optimizing their investment strategies.
As Congress implements fiscal policies that impact the economy, investors may find it beneficial to leverage platforms to stay updated on market developments and adapt their stock portfolios accordingly. These platforms provide a valuable resource for those seeking to make sense of the complex interplay between fiscal policies, monetary policies, and the stock market.
The dollar’s relative value (trade-weighted) has been falling steadily since Trump was elected. It’s now lost about half the average gain it made from 2014 to 2015.
The tax cut didn’t do a thing to reverse the decline so it’s pretty clear that capital outflow of U.S. dollar asset holders is continuing to occur along with foreign national’s and gov’ts cashing in their dollar denominated assets in favor of Euro, Yen, Pound, and Swiss Franc’s predominantly.
Capital owner’s confidence in the U.S. dollar’s value and U.S. economic growth under this administration and congress is and has been obviously lacking.
In effect this has been and still is flooding the market with dollars with increasingly lower demand for them… sort of like printing dollars. Too many dollars chasing too few goods is an inflationary prescription for U.S. goods and services (e.g. assets).
Capital owners hate inflation more than anything else so the sell-off in dollars is generating an inflationary spiral, which might fool the general American public into thinking the US economy is booming in nominal dollar terms when in fact its’ gong the other direction in real terms.l.
Spencer,
“Stocks have gone from overvalued to fairly valued”
Case Shiller PE strongly disagrees with your assessment that stocks are now fairly valued in reality.
http://www.multpl.com/shiller-pe/
Yes, you are right about Case Shiller. and that is a valid point.
But remember the old stock market wisdom that every time a stock changes hands someone is making a mistake– either the buyer or the seller.
Also remember, someone has to finance the twin deficits its is just a matter of at what prices.
https://seekingalpha.com/article/4145078-stocks-gone-overvalued-fairly-valued
” the dollar is weak despite the point that interest rate spreads between US and foreign rates are rising. ”
Should we expect an increase in this spread to appreciate the dollar? Yes if higher interest rates were coming from tight money driving up real interest rates. That would be the Dornbusch overshooting model.
But what if the rise in US nominal rates were from higher long-term expected inflation? Standard Global Monetarism would say this would be consistent with a nominal devaluation of the dollar.
Menzie Chinn documented today that half of the recent increase is an increase in real rates but the other half was a rise in expected inflation.
So does this suggest dollar devaluation or dollar appreciation? Any good international macroeconomic model would ask first what was the economic shock before answering this question.
“Case Shiller PE strongly disagrees with your assessment that stocks are now fairly valued in reality.”
Of course their index is not adjusted for the fact that the cost of capital is really low these days.
I’m well aware that academics like to work with real rates, but I;m not sure what is the advantage of using real rates vs nominal rates. If nominal rates are what is important and what I want to know about, how do real rates help me? Aren’t you just dividing both sides of the equation with the same variable?
Case Shiller is a good long run indicator but I have never thought that it was of much use to investors who have to make short run portfolio adjustments.
pgl
“Of course their index [case-shiller) is not adjusted for the fact that the cost of capital is really low these days.”
So when the stock market PE June 2007 was 18 climbing to 22 by December and rates were 5.1%, (e.g .realy high) case shiller was not adjusted for higher costs of capital either was it..https://fred.stlouisfed.org/series/GS10
http://www.multpl.com/table?f=m
Cost of capital has zero to do with real PE.