Insanely Concentrated Wealth Is Strangling Our Prosperity
By Steve Roth (originally published at Evonomics)
Today’s mountains of wealth throttle the very engine of wealth creation itself.
Insanely Concentrated Wealth Is Strangling Our Prosperity
Remember Smaug the dragon, in The Hobbit? He hoarded up a vast pile of wealth, and then he just hung out in his cave, sitting on it (with occasional forays to further pillage and immolate the local populace).
That’s what you should think of when you consider the mind-boggling hoards of wealth that the very rich have amassed in America over the last forty years. The picture at right only shows the very tippy-top of the scale. In 1976 the richest people had $35 million each (in 2014 dollars). In 2014 they had $420 million each — a twelvefold increase. You can be sure it’s gotten even more extreme since then.
(Dan here…The chart is placed at the end of the post due to format reasons)
These people could spend $20 million every year and they’d still just keep getting richer, forever, even if they did absolutely nothing except choose some index funds, watch their balances grow, and shop for a new yacht for their eight-year-old.
If you’re thinking that they “deserve” all that wealth, and all that income just for owning stuff, because they’re “makers,” think again: between 50% and 70% of U.S. household wealth is “earned” the old-fashioned way (cue John Houseman voice): it’s inherited.
The bottom 90% of Americans aren’t even visible on this chart — and it’s a very tall chart. The scale of wealth inequality in America today makes our crazy levels of income inequality (which have also expanded vastly) look like a Marxist utopia.
American households’ total wealth is about $95 trillion. That’s more than three-quarters of a million dollars for every American household. But roughly 50% of households have zero or negative wealth.
Now of course you don’t expect 20-year-olds to have much or any wealth; there will always be households with none. But still, the environment for young households trying to build a comfortable and secure nest egg — the American dream? — has gotten wildly competitive and hostile over recent decades. (If we had a sovereign wealth fund, everyone would have a wealth share from birth.)
But here’s what’s even more egregious: that concentrated wealth is strangling our economy, our economic growth, our national prosperity. Wealth concentration drives a vicious, downward cycle, throttling the very engine of wealth creation itself.
Because: people with lots of money don’t spend it. They just sit on it, like Smaug in his cave. The more money you have, the less of it you spend every year. If you have $10,000, you might spend it this year. If you have $10 million, you’re not gonna. If you have $1,000, you’re at least somewhat likely to spend it this month.
Here’s one picture of what that looks like (data sources):
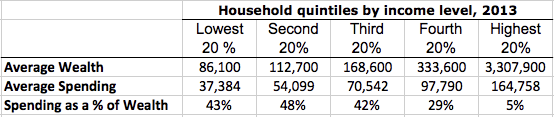
These broad quintile averages obviously don’t put across the realities of the very poor and the very rich; each quintile spans 25 million households. But the picture is clear. The bottom quintiles turn over 40% or 50% of their wealth every year. The richest quintile turns over 5%. For a given amount of wealth, wider wealth dispersion means more spending. It’s arithmetic.
Now go back to those top-.01% households. They have about $5 trillion between them. Imagine that they had half that much instead (the suffering), and the rest was spread out among all American households — about $20,000 each.
Assume that all those lower-quintile households spend about 40% of their wealth every year. They each get to spend an extra $8,000, and enjoy the results. Sounds nice. And it’s spending that simply won’t happen with concentrated wealth. The money will just sit there.
…transferring $2.5 trillion dollars, one time, is not going to achieve this imagined nirvana. Nor is it bloody well likely to happen. That example is just to illustrate the arithmetic. Absent some serious changes in our wildly skewed income distribution (plus capital gains, the overwhelmingly dominant mechanism of wealth accumulation, which don’t count as “income”), that wealth would just get sucked back up to the very rich, like it has, increasingly, for the past forty years — and really, the past several thousand years.
If wealth is consistently more widely dispersed — like it was after WW II — the extra spending that results causes more production. (Why, exactly, do you think producers produce things?) And production produces a surplus — value in, more value out. It’s the ultimate engine of wealth creation. In this little example, we’re talking a trillion dollars a year in additional spending and production. GDP would be 5.5% higher.
If you want to claim that the extra spending would just raise prices, consider the last 20 years. Or the last three decades, in Japan. And if you think concentrated wealth causes better investment and greater wealth accumulation, ask yourself: what economic theory says that $95 trillion in concentrated wealth will result in more or better investment than $95 trillion in broadly dispersed wealth? Our financial system is supposed to intermediateall that, right?
Or ask yourself: would Apple be as successful as it is if its business model was based on selling eight-million-dollar diamond-encrusted iPhones? Broad prosperity is what made Apple, Apple. Concentrated wealth distorts producers’ incentives, so they produce, for instance, a million-dollar Maserati instead of forty (40) $25,000 Toyotas — because that’s what the people with the money are buying. Which delivers more prosperity and well-being?
This little envelope calc is describing a far more prosperous, comfortable, and secure society — far richer and and one hopes far more peaceful than the one we’re facing under wildly concentrated wealth. With the possible exception of a few very rich multi-generational dynasties, everyone’s grandchildren will be far better off 50 years from now if wealth is more widely dispersed. And over that half century, hundreds of millions, even billions of people will live far richer, better lives.
Why wouldn’t we want that? Why wouldn’t we do that? (We know the answer: rich people hate the idea — even those who aren’t all that rich but foolishly buy into the whole trickle-down fantasy. And the rich people…have the power.)
By contrast to that possibility, here’s what things look like over the last seven decades:
Here are the results — growth in inflation-adjusted GDP per capita:
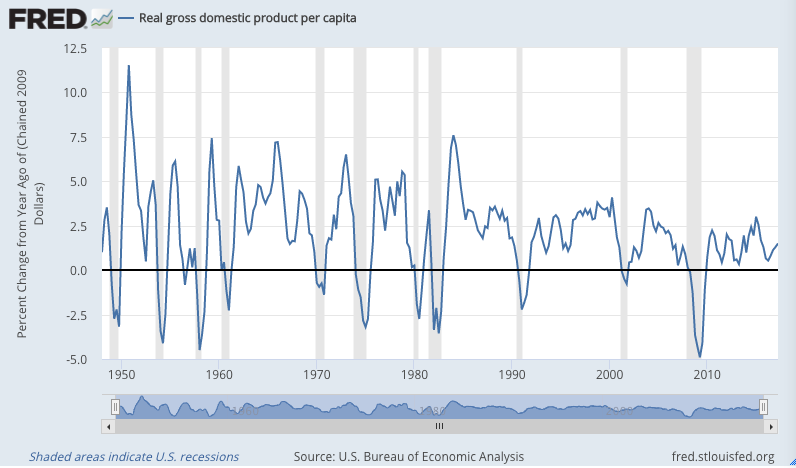
The last time economic growth broke 5% was in 1984. And the decline continues.
So how do we get there, given that we’ve mostly failed to do so for millennia? Start with a tax system that actually is progressive, like we had, briefly, during the postwar heyday of rampant and widespread American growth and prosperity. And greatly expand the social platform and springboard that gives tens of millions more Americans a place to stand, where they can move the world.
All of this dweebish arithmetic, of course, doesn’t put across the real crux of the thing: power. Money is power. So it is, so it has been, and so it shall be in our lifetimes and our children’s lifetimes (world without end, amen). This is especially true for minorities, who have been so thoroughly screwed by our recent Great Whatever. Money is the power to walk away from a shitty job. To hire fancy lawyers and lobbyists, maybe even buy yourself a politician or two. If we want minorities to have power, they need to have money.
Add to that dignity, and respect, which is deserved by every child born: sadly but truly, they are delivered to those who have money. You can bemoan that reality, but in the meantime, let’s concentrate on the money.
If you want to create a workers’ utopia, a better world for all, seize the wealth and income.
2017 September 18
Data Sources
The data for the tall chart is from Gabriel Zucman, PSZ2016AppendixTablesII(Distrib).xlsx Table TE3. Google sheet with data and chart here.
Average wealth by quintile is from the Federal Reserve’s Survey of Consumer Finance (SCF), scf2013_tables_internal_nominal.xls, Table 4. (Top 20% wealth in the table above is an average of the means for 80-90% and 90-100%.) The most recent triannual SCF release, covering 1989-2013, determined the year chosen for the table. The next release, through 2016, should be out imminently.
Spending by quintile is from the BLS Consumer Expenditure Survey (CEX; earlier years here), Table 1101 (adjusted; see below): https://www.bls.gov/cex/2013/combined/quintile.xlsx. All annual expenditure-by-quintile tables 1984-2016 in one spreadsheet here.
Note: Measuring expenditures is very difficult, especially the spending of the very rich. They’re not keen to answer lengthy surveys like the CEX, given that they don’t even want their housekeepers to know that they paid $6 for a loaf of bread. As a result, CEX — which breaks out spending by quintile — missesabout 40% (xlsx) of the spending tallied in the BEA’s Personal Consumption Expenditures (PCE) — which doesn’t. As a rough corrective for that discrepancy, the spending-by-quintile figures in the table above are CEX measures multiplied by 1.66. This “PCE correction” results in far more plausible spending figures, especially for the top 20%: Average $165,000 in 2103 annual spending versus CEX’s $100,000.
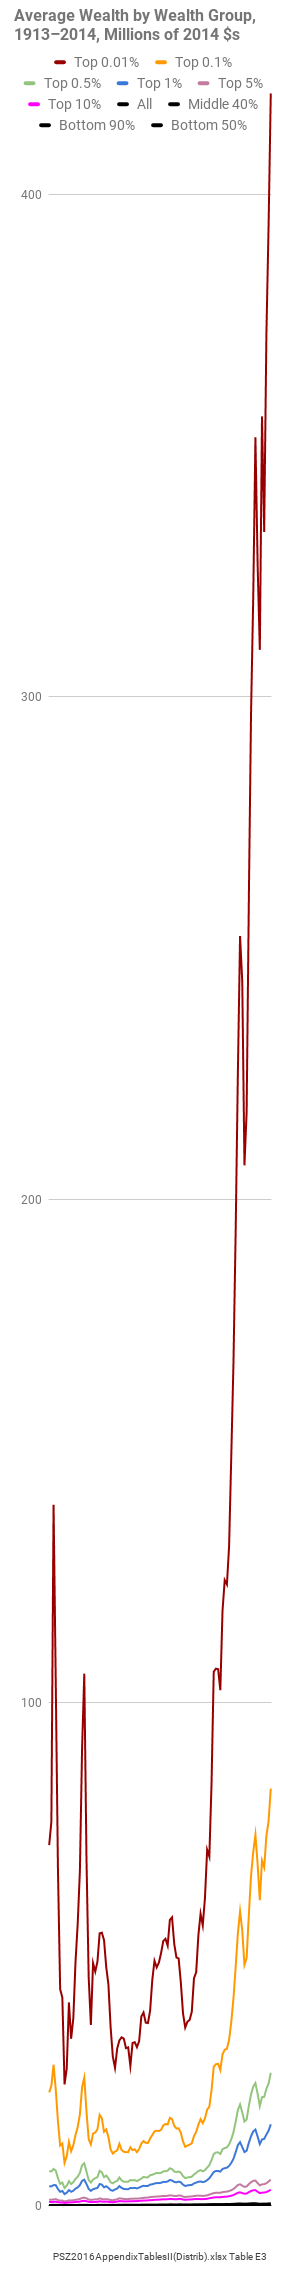
Bottom (visible) pink line is the top 10%.
In many ways it is a vicious circle.
The wealthy get large tax cuts that give them more income and creates an ever larger federal deficit. In turn the very wealthy buy the government debt that gives them more income that is used to finance the deficit. So you have an ever growing circle of income and debt that is outside the real economy and has little of no impact on the incomes or spending of the bottom 90%.
Treaty of harmonization with europe on revenue system design:
1. Worldwide basis
2. Common treatment of commercial activity (so there is some contribution to public finance and limits on using these regimes fir interjurisdictional compstition)
3. Net worth regime required with progressivity required as well
4. Income taxation must be progressive
5. Real property taxation permitted
6. Consumption taxation permitted but interjurisdictional competition restricted using this regime
7. Payroll taxes permitted
8. Overall the revenue system design must be progressive, fitting to agreed upon ratios that are common across the treaty participants, when affecting or looking at income flows
9. Net worth data and tax filing data shared for compliance reasons, required use of definitional norms (so things cant be criminally hidden)
10. Treaty portrays contry data for the entire intergovernmental revenue system
11. Law enforcement and juridical norms so criminals dont shop their residency for obvious reasons.
A well designed revenue system should raise revenues sufficient to finance the public’s choices and policies. This treaty would allow lower tax rates on day to day living to raise these sufficient sums, in part because the modest net worth tax raises new monies and because avoidance and criminal avoidance are curtailed.
It’s not a big deal — or maybe it is — but I wish we would trade in the word “inequality” for something like “disparity.” “Inequality” sounds so think-tankish which is fine for us regular progressives but kind of put-offing I think for Joe Six-Pack. It doesn’t reverberate in the brains of the 90% who are the ones we are trying to reach. (Doesn’t play very well in my brain to be frank — sounds like civil rights issue from the ’50s.)
How did we get here in the first place: disappearing labor unions. Does anyone think we would be in the shape we are in if we had a German-mirror labor market?
Super easy way back? When Democrats take over Congress, we have to institute mandatory union certification and re-certification elections at every work place (stealing a page from the Republican’s anti-union playbook). I would add the wrinkle of making the cycle one, three or five years — plurality rules — take a lot of potential rancor out of first time votes in some workplaces.
* * * * * *
Why Not Hold Union Representation Elections on a Regular Schedule?
November 1st, 2017 – Andrew Strom
https://onlabor.org/why-not-hold-union-representation-elections-on-a-regular-schedule/
Interestingly, this was mainstream economic thinking back in the 1930s. Everyone knew that the rich spent less back then. Everyone knew that the depression was caused by a lack of demand. Everyone knew that the only way out was to force the wealthy to spend money on goods and services by means of taxation and anti-trust enforcement. It took a long concerted campaign of propaganda to replace this with the nonsense that is accepted as conventional wisdom.
I’m glad to see individual bloggers and economists pushing back, but we need a much broader program. Where is the modern “Free to Choose”? In what venue could such a thing even be presented given the prevalence of corporate media?
High growth requires high investment which comes if demand is increasing.
Demand increased faster from 45 to 80 because household income was increasing because women were entering the work force.
Thanks, Mom.
Solutions?
I hear:
1) change attitudes of the wealthy to not want as much
2) inform the lower 90% that they’re getting screwed (presumably so they will vote to change it)..
#1 has never changed in al. human history. Nobody with power gives it up voluntarily. So kiss that solution good-bye — Utopian dreamers version.
#2 has been being tried since all human history that I’ve ever read about…. sometimes it very briefly works… revolutions and civil wars are the result. But miraculously a few years and decades later those with wealth have most of it anyway.
And about “voting” to change things.
Why hasn’t this changed yet then… all democracies vote all the time. There’s a very slow evolution of increases social systems & freedoms & justice over time but the wealth still accumulates at the top.
So voting doesn’t change that.
Why not?
Simply because in most democracies (where people can vote) about half of people always vote for traditional values and systems…. and about half vote to change those traditional values and systems to provide for more prosperity more widely shared.
And so gov’t decisions to change the status quo doesn’t occur except on rare occasions and then always without consequence to wealth accumulation at the top. Gee. Why is that? Who do you think controls gov’ts .. democratic or otherwise? At least that’s been the nature of human history of gov’ts.
I see no evidence of this changing simply because for one thing gov’ts are decided by those who have the power.. which is to say the concentrated wealth. And of course when they decide they insure their wealth cannot be encroached upon or reduced and in fact gov’ts insure that wealth can be increased and become even more concentrated. And why would they ever decide otherwise?
An interesting deviation from this occurred in France’s Revolution… which, after succeeding to overthrow the wealthy it quickly devolved into complete chaos, until dictators took over to restore order … and the source of the dictator’s power were the wealthy who financed them. It took another 100 years for France to finally establish a functioning democracy (and even this required the devastation of WWII).
So though the rhetoric of more widely distributed wealth makes rational sense for the good of most of the nation’s inhabitants, it’s not most of the nation’s inhabitants that control the wealth, and thus they also then can’t in fact control gov’t either.
FWIW…. somewhere along the line… I think it was in college… I lost my Utopian beliefs only because I could never (then nor since) figure out why what’s rationally best 95% of a nation’s inhabitants has never been realized or materialized. So I began to ask myself why. There’s a human systematic reason is the answer. The best that can be done is to occasionally upset the apple cart more or less and thereby try to distribute the wealth a little wider for a little while — until the power of wealth takes over again by slowly undoing whatever was accomplished by upsetting the apple cart in the first place.
If you want a more widely distributed system of wealth you have to start by changing the rules such that they cannot be changed to provide for the wealth to re-establish control. I’m not at all sure or confident this can be done.. it is probably another Utopian idealism.
“Demand increased faster from 45 to 80 because household income was increasing because women were entering the work force.”
Arne: what you fail to mention is the metric you are using GDP is biased to excluded household work. When Jill blows her husband it doesn’t count as GDP, but when she blows the neighbor and the neighbor’s wife blows Jill’s husband it counts as GDP, even though the same amount of work is done.
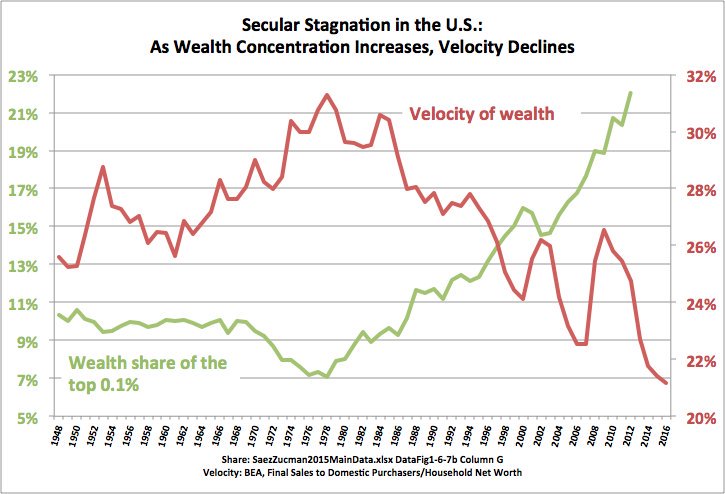
Chart your “velocity of wealth” vs the median age of the adult US population. Me thinks you might realize something. Wealth = integral from t=0 to T of Income(t) – Expense(t) dt