2016 Homicides
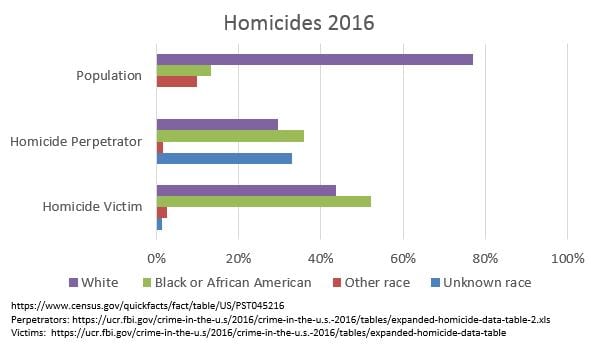
The FBI just released data on homicides for 2016. In light of the various protests by the BLM and now football players, I thought I’d provide a a graph. It breaks out population, homicide perpetrators and homicide victims by race.
(click to embiggen)
Note… the number of offenders exceeds the number of victims. This is a result of some homicides involving multiple perpetrators. This can happen, for example, if both the shooter and the getaway driver in a drive-by shooting are charged with the crime. The race breakdown comes from the FBI, and the population comes from the Census. Data sources are shown in the graph itself.
The key driver of the graph is the large percentage of perpetrators of unknown race. This happens because not all jurisdictions report on the race of offenders, but perhaps more importantly, because many crimes are not officially solved. I believe this is particularly true in urban areas with a lot of homicides where nobody wants to cooperate with the police. For example, through August of 2016, the clearance rate for homicides in Chicago was 21 percent. In Baltimore, its about a third. Nationally, its about two thirds.
This isn’t surprising. For a long, long time, the policy has been that the police are there to keep the blacks in place, not to deal with black on black crime. Needless to say, blacks avoided the police. They were never there to help you, and most likely there to harm you.
The charts show that having a police force trusted by the community can lower the crime rate. The problem is earning that trust. Trust doesn’t come from giving the police license to kill without consequences.
(The current attack on illegal immigrants isn’t going to help things either. If people, even people who are illegally in the country, are afraid to go to the police or cooperate with them for fear of being deported, that makes it easier for organized crime to take over the community. We’ve seen this before.)
We knew Mr. Kimel would pull the new 2016 FBI crime stats it’s his favorite racist based source of “evidence”.
As for the chart, with minor differences its a repetition of every FBI crime stats chart since day one. What else is new? You’d think that with decades of the same results over and over and over again policy makers would go after the source of the problem but they don’t.. reason is simple:
1) It costs more to fix the source of the problems than using police state tactics.
2) At least half the white voting citizens in the U.S. are racists..
The perpetual synopsis by half the whites in the nation is to lock up the Blacks and throw away the key… then maybe the policy makers will go after the sources of the white perpetrators of crime.
This is old hat.
Can’t help but notice that the black/white proportions of victims is roughly the same as perpetrators.
Kaleberg,
Sorry. I am not seeing what you’re seeing . Please explain how the figures show this:
It isn’t that I don’t agree with the statement, it is that I don’t see how it follows from the data presented.
Longtooth,
Yeah. But even more noticeable is the big blue bar for perps that isn’t there for vics.
Kaleberg,
On the subject of a community’s trust, I have a follow-up here:
http://angrybearblog.com/2017/09/people-killed-by-police-2016.html#more-41850