How Perfect Markets Concentrate Wealth and Strangle Growth and Prosperity
by Steve Roth (Lifted from Asymptosis)
How Perfect Markets Concentrate Wealth and Strangle Growth and Prosperity
June 5th, 2016
Capitalism concentrates wealth. Ridicule Marx and his latter-day disciples all you like (I’ll help); he definitely got that right.
But capitalism is a big word with lots of meanings, and enough ideological baggage to fill a Lear Jet. Let’s talk about something more precise: perfect markets, with ownership, in which individuals compete with others to produce stuff, and store up savings. You can see this kind of perfect world in agent-based simulations like Sugarscape. Start with a bunch of sugar farmers trying to accumulate sugar in an artificial world, hit Go, and watch what happens.
Here’s what happens to wealth concentration (number of poorer farmers on the left, richer on the right):
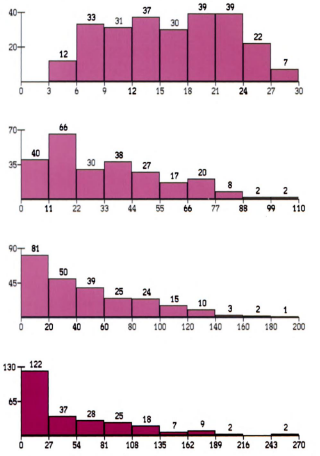
Wealth is pretty evenly distributed at the beginning (top). That doesn’t last long. You can see the same effect in another Sugarscape run, here compared to real-world wealth distributions:
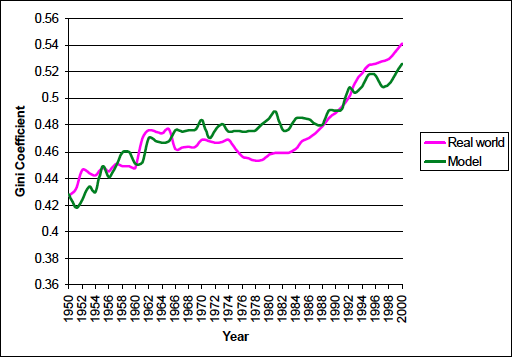
That’s the Gini coefficient for wealth. Zero equals perfect equality; everyone has equal wealth. 1.0 equals perfect inequality; one person has all the wealth.
Perfect markets concentrate wealth. It’s their nature. But at some point, market-generated wealth concentration strangles those very markets (compared to markets with broader distributions of wealth). If a handful of people have all the wealth, how many iPhones will Apple sell? If only a few have the wealth to buy cars, automakers will produce a handful of million-dollar Bugattis, instead of forty handfuls of $25,000 Toyotas. Sounding familiar?
But wealth concentration doesn’t just strangle the flows of spending, production, and income. It throttles the accumulation of wealth itself. Another simple simulation of an expanding economy (details here) explains this:
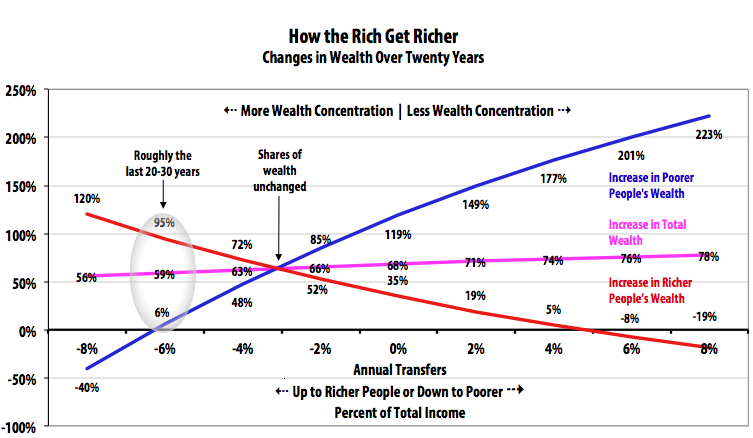
The dynamics are straightforward here: poorer people spend a larger percentage of their income than richer people. So if less money is transferred to richer people (or more to poorer people), there’s more spending — so producers produce more (incentives matter), there’s more surplus from production, more income, more wealth…rinse and repeat.
This picture says nothing about how the wealth transfers happen (favored tax rates on ownership income, transfers to poorer and older folks, free public schools, Wall Street predation, the list is endless). It just shows the results: As wealth is transferred up to the rich, on the left, and wealth concentration increases, our total wealth increases more slowly. When that transfer is extreme, even in this growing economy the poorer people end up with less wealth. (Note how the curves get steeper on the left.) As wealth concentration declines on the right, our total wealth increases faster, and poorer people’s wealth increases much faster. Note that richer people still get richer in most scenarios — it’s a growing economy, always delivering a surplus from production, and increasing wealth — just more slowly.
And that’s just talking dollars. If we start thinking about our collective “utility,” or well-being — the total of everybody’s well-being, all summed up — the effects of wealth concentration are even more profound. Because poorer people getting more does a lot more for their well-being than richer people getting more. (Likewise, even if the richer people actually lose some of their wealth, they’re not losing as much utility.)
Because: Declining marginal utility of wealth (or consumption, or whatever). This is one of those Econ 101 psychological truisms that seems to actually be true. The fourth ice-cream cone (or Bugatti, or iPhone) just doesn’t deliver as much utility as the first one. Plus, a Bugatti in one person’s hands doesn’t deliver as much utility as forty Toyotas in forty people’s hands. (Prattle on all you want about relative and revealed preferences; you won’t alter this reality.)
So if we were to re-work the chart above showing utility instead of dollars, you’d see far greater increases in utility on the right side, especially for poorer people. Widespread prosperity both causes and is greater prosperity.
Why, then, aren’t we spending our lives on the right side of this chart? It’s a total win-win, right? The answer is not far to find. Nassim Taleb shows with some impressive math (PDF) what’s also easy to see with some arithmetic on the back of an envelope: if a few richer people (who dominate our government, financial system, and economy) have the choice between making our collective pie bigger or just grabbing a bigger slice, grabbing the bigger slice is the hands-downwinner.
That’s why decades of Innovative Financial Engineering has served, mostly, not to efficiently allocate resources to efficient producers, improve productivity, or increase production. Rather, these fiendishly clever entrepreneurial inventions control who gets the income from production. You can guess who wins that game. Top wealth-holders would be nuts to play it any other way (if you go with economists’ definition of rationality…).
But for the rest of us, it’s a loser’s game — at least compared to the world we could be living in. If household incomes had increased along with GDP, productivity, and other economic-growth measures for the last two or four decades, a typical household would have tens of thousands of dollars more to spend each year — and much bigger stores of wealth to draw on. If you think that sounds like a thriving, prosperous society…you’re right.
To summarize: perfect markets, left to their own devices, concentrate wealth. Concentrated wealth results in less wealth, and far less collective well-being. (You’ll notice that I haven’t even mentioned fairness. It matters. But I’ll leave that to my gentle readers.)
This all leads one to wonder: how could we move ourselves into that happy world of rapidly increasing wealth and well-being on the right side of the graph? Hmmmm….
Steve,
Interesting read. A lot to chew on.
“how could we move ourselves into that happy world of rapidly increasing wealth and well-being on the right side of the graph?”
MY ANSWER — GOING OUT TO CALIFORNIA THIS WEEK (first, unions and activists, then journalists, finally legislators) — EVENTUALLY AROUND THE COUNTRY. We have to — quickly rebuild US union density. Was just thinking: Chicago going to $15 min wage ($14 after inflation) over the typical five years just gives academic progressives a breather from having to do much. At the end of five years Chicago’s West side and South side will still be as poor and violent. TIME TO RESTRUCTURE FROM THE BOTTOM UP.
******************************
I believe that so many registered voters in California would sign a ballot initiative to make union busting a felony — that they might have to line up around the block. Basic requirement: need as many registered voters to sign up as 5% of last governor’s race voters (365,000). Basic source: 45% nationally earn $15/hr or less –- and –- bottom 45% incomes nationally down to 10% of overall income share from 15% two generations earlier (California wages higher, but prices too).
The latter means 33% less of twice as much, true — but — people judge their well being as compared to others — besides — the very bottom 10-15% are down in absolute terms (today’s $7.25/hr federal minimum wage compared to 1968’s $11.45/hr).
https://data.bls.gov/cgi-bin/cpicalc.pl?cost1=1.60&year1=196802&year2=201705
Shill effect: As a Manhattan and Bronx street peddler in the early 1970s I could wait for ten minutes for somebody to make a buy – but as soon as someone did, four other people might suddenly shell out too.
I’m not suggesting fooling voters (potential signers) with fake lines around the block. I am suggesting doing lines around the block as our primary demonstration –- the kind of image loved by TV cameras on the six-o’clock news. We could even start “demonstration”-demonstration lines before the precise legal language of the initiative is prepared (not trying to fool anybody there) just to get the initiative idea rolling (around the block :-]).
* * * * * *
Suppose that a few states happened to impose (they didn’t) criminal law penalties for union busting, back in 1935, when Congress passed the NLRA(a) and set up the NLRB(b). Why would anyone suppose that federal regulatory machinery would preempt state criminal court prosecutions?
Farm workers were deliberately left out the NLRA(a) in 1935 (traded for passage votes). California (only) has a virtual mirror image of the NLRA/NLRB for farm workers — the CALRA. If ever a (future Democratic) Congress moved to include farm workers under the NLRA(a) — the CALRA would presumably bow out to federal preemption.
OTH, if Congress should wake up and make union busting a federal felony — triable and punishable in criminal court — there is no such presumption that state union busting prosecutions would bowl over — no more than state bank robbery prohibitions or state minimum wage regulations give way to federal preemption.
Lest there be any doubt: With First Amendment protected freedom of association at stake (except for government workers say the courts), federal regulations or even (if) deliberately restrictive laws cannot force organizing rights down an impassable road.
*********************************
IF IT WORKS YOU HEARD IT HERE FIRST (idea is to spread in ballot initiative states and get thinking going in more progressive states, etc.
Capitalism needs market growth.
I do not see any inherent mechanism whereby capitalism will deliver gains to workers. On the contrary, if I model a steady population of workers in an economy with increasing productivity, I see the rich getting richer at the workers expense (as posted) and eventually demand decreases because the primary consumers have less money.
The mechanism that brought gains to workers (beyond unionization) was the growth of the consumer class. Through urbanization as we needed fewer agricultural workers to women moving into the workforce, the consumer class has grown. It has reached an asymptote. The US market only grows via population increase.
I was pointing this out here in 2008:
http://angrybearblog.strategydemo.com/2008/12/income-distribution-and-gdp-it-matters.html
In 2011 I put it in a more personal perspective based on my ownership of a flower shop. Yes, I still have it. http://angrybearblog.strategydemo.com/2011/05/monetary-policy-im-sorry-its-just-not.html