That’s what I’m talkin’ about! (Ireland)
I have argued many times (most directly here) that, contrary to the claims of nearly all Irish policymakers, low taxes are not what makes the Irish economy tick. The country experienced 30 years of low taxes with no gain on average European income; it was only after 1987 that other policy changes (education, EU-funded infrastructure, and Social Partnership) led to gains on the EU average. Thanks to a Tax Justice Network blog post, I now have a great illustration to show this in living color.The graph below plots Irish income per capita as a percentage of the EU average from about 1955 to 2012, with important dates noted as vertical lines. Notice that Ireland doesn’t get above 60-65% until after 1990. In addition, the Commission-enforced increase in the corporate income tax rate from 10% to 12.5%, which took effect in the early 2000s, had no impact on the Celtic Tiger’s spectacular rise in income per capita relative to the EU average. This means Ireland had higher growth when the tax rate was 12.5% than when it was 0%!Q.E.D.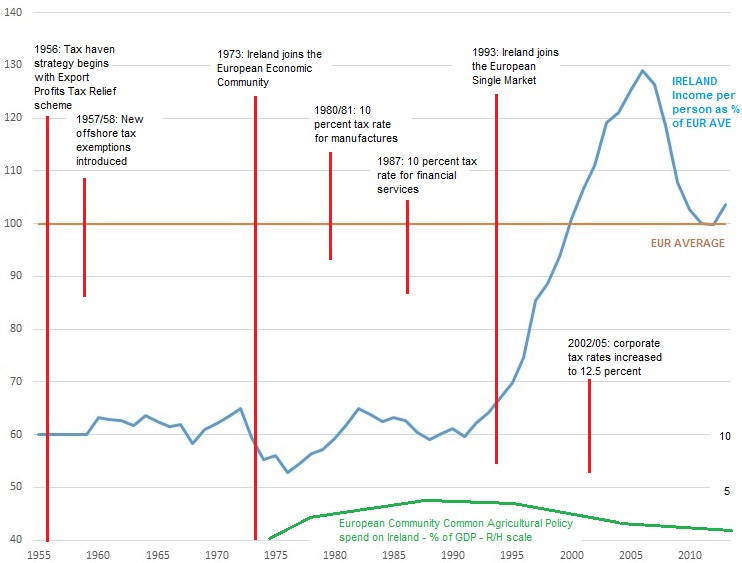
Source: Tax Justice Network, link above
Cross-posted from Middle Class Political Economist
Shame on you for muddying things up by looking at the facts..
Wait, wait, wait! They must have raised taxes just before their economy crashed in 2009. Right?
It’s absolutely disgusting that this supply-side snake oil was sold so successfully for so long, in so many countries.
Great post, Kenneth.
Ken Thomas
nice. too bad it will have no effect on policy or economic “reporting.”
Thanks for the kind words. Beverly, not only is the answer no, but Ireland’s problems stem from assuming a bunch of private bank debt. Coberly, true, but we have to keep plugging away at them.
Hey Ken:
I was at the Stuttgart Oktoberfest taking down litres of beer. Two Irish sat with my German VP and associates. They were complaining about the debt which in comparison to our $trillions was ridiculously small. I offered to write a check for them to cover the debt. They did not have to suffer what they did and any major country of the 7 probably could have relieved them of it and screwed the banks.
Where is that R/H scale ?
David,
Sorry, it seems to have cut off. The Common Agricultural Policy line peaked at about 4% around 1990.
They really should add Structural Funds to the graph, because that is several more percentage points of GDP.