Real Household Net Worth: Look Out Below?
In my last post I pointed out that over the last half century, every time the year-over-year change in Real Household Net Worth went negative (real household wealth decreased), a recession had either started, or was about to. (One bare exception: a tiny decline in Q4 2011, which looks rather like turbulence following The Big Whatever.) Throughout, click for source.
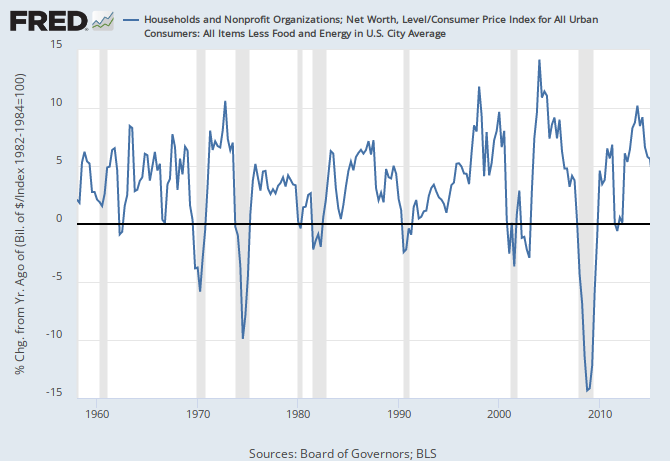
The problem: we don’t see this quarterly number until three+ months after the end of a quarter, when the Fed releases its Z.1 report for the the preceding quarter. The Q2 2015 report is due September 18.
But right now we might be able to roughly predict what we’re going to see four+ months from now, in the report on our current quarter, Q3, which ends September 30. We’re a bit over a month from the end the quarter, and we have some numbers to hand.
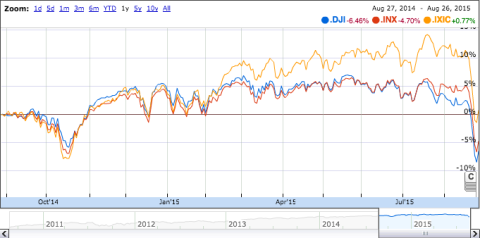
The U.S. equity markets are down roughly 7% year-over-year (click for source):
Total U.S. equities market cap one year ago was about $20 trillion:
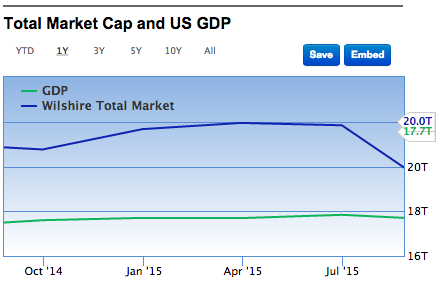
So a 7% equity decline translates to a $1.4-trillion hit to total market cap, which goes straight to the lefthand (asset) side of household balance sheets, because households ultimately own all corporate equity — firms issue equity, and households own it (at one or more removes); people don’t issue equity in themselves, and firms don’t own people (at least not yet). It’s an asymmetrical, one-way ownership relationship. (Note: yes, the Fed accounts for household net worth on a mark-to-market basis.)
Total household net worth a year ago was $82 trillion. The $1.4 trillion equity decline translates to a 1.7% decline in household net worth.
Meanwhile household liabilities over the last four quarters have been growing at a fairly steady rate just above 0.2% per year. There’s no reason to expect a big difference in Q3.
This suggests a 1.9% decline in household net worth over the last year, based on the equity markets alone. (My gentle readers are encouraged to add numbers for real estate and fixed-income assets.) Add (subtract) 1.5% in inflation over that period, and you’re looking at something like 3.4% decline in real household net worth, year over year.
Unless the stock market rallies by 10% or 15% before the end of September ($2–3 trillion, or 2.5–3.5% of $80 trillion net worth), it’s likely we’ll see a negative print for year-over-year change in real household net worth when the Fed releases its Z.1 in early December of this year. And we know what that means — or at least we know what it’s meant over the last half century.
You heard it here first…
Cross-posted at Asymptosis.
Sorry, but the data doesn’t support your position. Lets note the acceleration in GDP in the 3rd quarter………..again.
I will add, my own company has had its best 2 month(July, August) since 2010.
@The Rage:
>Lets note the acceleration in GDP in the 3rd quarter………..again.
?? Where are you getting that measure from…since the third quarter is only 2/3 over?
> my own company has had its best 2 month(July, August) since 2010
I’m sure Janet Yellen will be carefully considering that important national data point and widely influential trend.
…meow meow meow…
But yes, depending on what Rage’s company is, it could be an indicator or a contra indicator. SOME businesses surely did well during the ’08 collapse, the 1929 crash, and the Plague years.
I am sure, too, that someone studies which businesses prosper in bad times, and which falter, and why. Smaller, marginal businesses (that is, things that people can easily forego, like cut flowers) might be candidates for being trampled underfoot when things go wahoonie-shaped. On the other hand, I remember quite a number of postings last decade discussing the boom in specialty coffee shops and high-end bicycle sales, said to be prospering because they were the next step down from fancy restaurants and expensive cars — I.e. cheaper luxuries supplanting pricier ones.
Noni
I have a hard time figuring out how an equity market decline means a whole lot in such a short period, especially when you consider that wealth is mainly in the hands of the 1% who weren’t going to do anything with it and the rest is in the hands of people with retirement accounts who weren’t going to do anything with it for awhile.
Seems like an effect, not a cause.
Lower equity prices generally mean fewer IPO’s. IPO’s usually provide cash to expand business.
Warren, in general, I would agree. But the move up hasn’t been that impressive. IPO’s price is pretty set in tune.
Lets note the graph basically shows the rise of “bubbles” aka stocks,real estate and commodities. The last may actually hurt the economy in some respects.
The analysis seems a little thin. I mostly deals w/ a market decline to say net wealth has declined.
The US does not own ever share of stock. Plenty are owned by foreigners so only part of the decline will affect the US’s calculations.
Many US individuals own foreign stock some of their declines are better & some are worse.
US home prices according to Case/Shiller have been increasing adding to US net worth.
There is also a large portion of US wealth in private equity from the sole proprietor to VC’s & hedge fund buyouts. Those will probably track with the economy but we know the 2Q GDP was better that expected so there is a good chance that private equity has increased in value.
I’m just not seeing a smoking gun.