Did the Fed Cause the Great Recession?
With the release of the Fed’s Open Market Committee Meeting minutes from 2008, it has been confirmed that the Fed was too concerned about inflation, and, to quote Marcus Nunes, “worse, the headline kind” leading into the 2008 crash. The Market Monatarists cite this as evidence that the Fed was responsible for turning a potentially pedestrian downturn into the Great Recession. See David Beckworth here.
I’m not here to defend the Fed, but there are two issues. The first issue is their behavior – and if they mistook 2008 for 1978, that is inexcusable.
And, as Marcus points out, it looks like they did. [Emphasis his]
Two speeches by voting Regional Fed presidents certainly helped perceptions along:
Plosner (July 22): Keeping policy too accommodative for too long worsens our inflation problem. Inflation is already too high and inconsistent with our goal of — and responsibility to ensure — price stability. We will need to reverse course — the exact timing depends on how the economy evolves, but I anticipate the reversal will need to be started sooner rather than later. And I believe it will likely need to begin before either the labor market or the financial markets have completely turned around.
Hoenig (July 16): “While the comparison to the ´70s can be useful(!), the present economic situation is also different…
However, like the 1970s, monetary policy is currently accommodative(!)…In this environment there is a significant risk that inflation and inflation expectations could move higher in coming months.
Thus, it will be important for the Federal Reserve to monitor inflation developments and inflation expectations closely, and to move to a less accommodative stance in a timely fashion”.
By their words shall you know them. But only if you’re paying attention.
Let’s look more closely at that first issue – Fed behavior. What was happening with inflation, and how did the Fed react? Graph 1 shows headline inflation in blue and core inflation in red.

In mid 2008, core inflation was running at 2.3 to 2.5%, not far off its decade-long average of 2.2%, and had been pretty stable year to date. Headline inflation, however, had taken a big jump. As Graph 2 shows, headline inflation, now in red, was following the producer price index, in blue, which had taken an even bigger jump.

As these graphs show, core inflation – which is what, if anything, policy makers ought to be reacting to – is much less volatile, and did not look at all like cause for concern. But, as Steve Roth pointed out a while back, fighting inflation is the only part of its alleged dual mandate that the Fed takes seriously. The scorpion has to follow its nature.
Meanwhile, what was the economy doing back in 2008?
As Graph 3 shows, the growth in personal consumption expenditures had been in steady decline from the local high of just over 7% in 2005, was more or less stable through the first half of 2008 at about 4%, but then fell off to 1% in October. It was deeply negative by the end of the year.

Not surprisingly, NGDP growth followed a similar path. See Graph 4

Meanwhile, Real Median Household Income, which had risen modestly from 2005-7, was slumping, probably due to income lost in the housing construction bust. See Graph 5.

So, I think it’s right and proper to criticize the Fed for their focus on inflation. With 20/20 hindsight, it looks spectacularly wrong-headed.
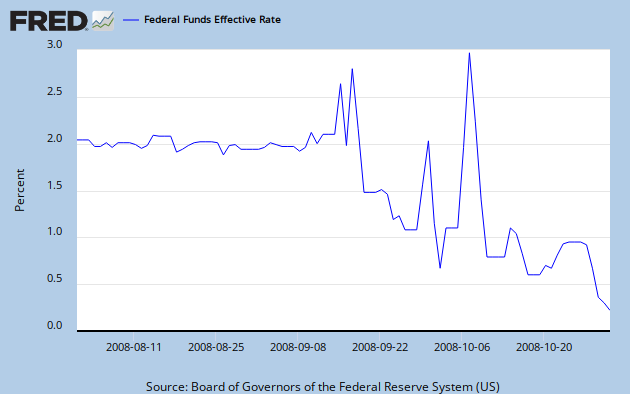
The second issue is cause and effect between Fed action and the condition of the economy. Did the Fed really spawn the Great Recession in 2008? David Beckworth says yes, and I believe the Market Monitarist community is unanimous on this point. But let’s look at what the Fed actually did. Graph 6 shows the Effective Federal Funds Rate in blue. Also included for reference is the Prime Lending Rate, in red, which follows in lock-step.

The Fed Funds rate was shaved a bit from about 5.25% in the 3rd quarter of 2007, then cut dramatically to 2% by the end of the first quarter of ’08. In statements from the Open Market Meetings of August 5 and September 16, the FF target rate was kept at 2%. Clearly, that decision did not hold, as the rate was hovering near 0% by the end of the year.
I hope I’m not misstating the Market Monetarists’ stance when I say that they believe the Fed has essentially unlimited power to achieve whatever targets it chooses, and that in managing expectations, Fed words speak louder than actions. In a comment at Beckworth’s post, linked above, I asked the following:
Regardless of what the Fed did or didn’t say; during the first quarter of 2008, The Fed funds rate was cut in half from 4% to 2%, and between August and December dropped to almost zero.
Why do words [or the absence of words] trump what is actually happening in the real world? What percentage of the population has even the slightest awareness of the FOMC? Why would their announcements influence behaviors in the general population?
On October 8, they announced a 50 basis point cut to 1.5%, then to 1.25% on 10/29, on 12/16 the target was reduced to 0 to 1/4%.
When you consider that until the Fall of ’07, the Fed Funds rate was over 5%, they did rather a lot taking it to essentially 0 in about 14 months.
What am I missing?
Part of his answer [read it all here, reposted as a follow-up here] was –
As I noted in the post, the key is to change the expected path of monetary policy. That means more than changing the federal funds rate. It means committing to keeping it low for considerable time like the Fed did in 2003 and signalling it clearly and loudly. With this policy, the Fed would have provided a check against the market pessimism that developed during this time. Instead, the Fed did the opposite: it signaled it was worried about inflation and that the expected policy path could tighten. So, yes, the correct response is far more than just cutting the federal funds rate, it is about setting expectations about the future path of policy and the future economic outlook.
I have a hard time accepting this ignore what I do, pay attention to what I say [or don’t say] argument. It has to assume that people are deciding their actions by thinking months or years into the future based on what they think the Fed might do then, instead of reacting to what is happening today. Maybe I’m just disoriented by the time travel, but in a world where the major focus is on the current quarter’s returns, I don’t think very many actual people behave that way. Nor do I believe that the hoi polloi have even the vaguest awareness of Fed activities, let alone their words.
The Market Monetarist response, from Marcus is, “Interest rates are a terrible (even misleading) indicator of the stance of monetary policy.” At his article linked in the first paragraph of this post, Marcus indicates that the true stance of monetary policy is the resulting growth in NGDP – which I believe, as post-hoc as it may be, is the axiom on which Market Monitarism rests.
But there are other reasons to disagree. Krugman provides two. First, “We were in the midst of an epic housing bust, which was in turn causing a collapse in the value of mortgage-backed securities, which in turn was causing a collapse of confidence in financial firms.” This strikes me as being a market failure, aided and abetted [if not actually caused] by weak lending standards and lax regulation, and thus totally outside the realm of anything that can be effected by either setting or talking about interest rates, especially after the fact.
Second, “what we actually know is that the panic was in fact fairly short-lived, ending in the spring of 2009. . . . Yet the economy didn’t come roaring back, and in fact still hasn’t. Why? Because the housing bust and the overhang of household debt are huge drags on demand, even if there isn’t a panic in the financial market.” Again, it doesn’t seem likely that Fed action or words would have any effect on this outcome.
Further, as Stephen Williamson puts it, “So, it’s like there was a fire at City Hall, and five years later a reporter for the local rag is complaining that the floor wasn’t swept while the fire was in progress.” A bit on the snarky side, but he also points out that the Fed had lost control of the Fed Funds rate at this time, anyway, due in part to risk perceptions. This is shown in Graph 7. What does this tell us about expectations at a time of panic?
He also indicated that the Fed loaned substantial amounts to financial institutions, starting early in ’08, and increasing dramatically in September and October. This is shown in Graph 8.

There was a lot of overt Fed action in 2008. Maybe it was a bit sluggish, but if so, it was only lagging real world events by a few weeks. They might have acted a bit quicker, but I don’t see any more they could have done, other than talking differently.
Can those words really have been the cause of the greatest financial disaster in 80 years?
Afterthought: It’s entirely possible that the Fed, and most particularly bubble denier Alan Greenspan, were complicit in the many-years-long prelude that set the stage for the crash. But that was much earlier and really is a separate set of issues.
Oh those monetary policies. I’m still not feeling it.
With that, my question to the following statement: With this policy, the Fed would have provided a check against the market pessimism that developed during this time…
Which market is he talking about? The one the Fed’s dumped all that money in or the one that includes all those people who could not pay the mortgage regardless of the Fed rate who looked at $4/gal in gas in August, anticipated $4 in oil for heat meaning they needed come up with anywhere from $5000 to $6000 more that coming heating cycle and then started hearing and experiencing the layoffs?
Daniel –
That’s pretty much my point. Real things happen in the real economy to real people.
That is what they react to.
JzB
The implosion was coming anyway you go about it. Sorta like the US was experiencing unsustainable growth from 97-07 due to computers, Y2K, BRIC boom feeding money into financials like crazy by the mid-oughties until it busted.
The Fed was irrelevant.
First, let me say that this is a thoughtful and clearly written post, although I don’t agree with your reasons for disagreeing (maybe more on that later if I have the time).
But the following claim caught my attention:
“In mid 2008, core inflation was running at 2.3 to 2.5%, not far off its decade-long average of 2.2%, and had been pretty stable year to date.”
I knew right away this was incorrect in several respects and I had a hard time figuring out why until I realized that you were looking at core CPI and not core PCEPI.
The Fed has never targeted core CPI. It targeted headline CPI from 1988 until 1999. In 2000 it switched to targeting PCEPI. In 2004 it switched to targeting core PCEPI.
Why does this matter? because the behavior of core CPI and core PCEPI was radically different over the period in question:
http://research.stlouisfed.org/fred2/graph/?graph_id=164121&category_id=0
Note that core PCEPI was significantly lower than core CPI until 2003. year on year core PCEPI had been as low as 1.0% in June 1998. It averaged just under 1.9% in the decade through June 2008. It reached 2.3% in May through August 2008 and that was only a tenth of a percentage point below the highest level it had been in the previous 15 years.
The reasons for the divergence of core PCEPI from core CPI relate to healthcare and housing but that’s not really important in my opinion. Nor am I trying to justify the inflation hawks’ behavior in 2008. But I do think it’s important that we look at the inflation measure that the Fed was actually paying attention to.
JazzBumpa wrote “Can those words really have been the cause of the greatest financial disaster in 80 years?”
Add one more graphic, and you will be closer to the truth.
See page 3 at this link:
http://www.newyorkfed.org/research/national_economy/householdcredit/DistrictReport_Q42010.pdf
Consumers were adding large amounts of debt to supplement their earned income. Some choose to ignore Total Consumer Debt because most of the debt was in mortgages. In isolation that might even seem reasonable.
See Table 2 for equity taken out of homes:
http://www.federalreserve.gov/pubs/feds/2007/200720/200720pap.pdf
This is the Greenspan and Kennedy study titled “Sources and Uses of Equity Extracted from homes”. You will see that every year after 1996 there was an increase in free cash from equity extraction. (See line 1)
So it seems to me that we are seeing PCE and non mortgage debt being paid for by equity extraction via mortgages. Both represented spending into the economy by consumers. And this went on year after year. (See line 109) And I don’t believe that line 109 included the cost of getting the loan which was also money spent into the economy.
Now ignoring mortgage debt does not seem so reasonable. And high total debt levels would tend to impair borrowers ability to get loans in the future. Especially if lenders returned to more conservative underwriting standards.
That continuing equity extraction was possible because housing appraisals were constantly going up. The appraisals went up because appraisers who failed to find increased value in the home were not going to get any business in the future. These mortgages had become a profit center for the mortgage brokers and the investment bankers who bundled them into mortgage backed securities. And they were not going to be stopped by some reluctant appraiser. The game proceeded so quickly that mortgage brokers began to offer loans of 125% of the appraised value.
But that equity extraction would have to be reduced after the housing bubble popped. (The pop came when home loans started to fail at a much higher rate than normal.) Then what would happen when that spending due to equity extraction was stopped? The economist Irving Fisher (1867-1947) believed that debt had brought on the Great Depression. Consumers were certainly sitting on a mountain of debt just before the Great Recession.
And you could take it one step further and ask why consumers were doing all that borrowing? I believe that was due to stagnant real personal incomes but that is not a requirement to assigning a cause for the Great Recession.
I believe that the FED was just reacting to the economy as they saw it. The common wisdom had become that the FED could deal with ANY problem, even if it required dropping money from helicopters. So they didn’t have to pop the housing bubble. They were wrong. Their primary tool was the Fed Fund Rate which allowed them to increase the money supply by increased borrowing. But that assumes an ever-present supply of credit worthy and motivated borrowers. The debt from the housing bubble impaired large numbers of potential borrowers and their collateral was impaired too as home prices fell.
Before I adress any of your specific disagreements, let me first point out that by the time 2008 rolled around monetary policy had been tight for two years.
The US Treasury yield curve became inverted in August 2006 and stayed that way through May 2007:
http://research.stlouisfed.org/fred2/graph/?graph_id=75581&category_id=0
Every US recession since WW II has been preceded by an inverted yield curve in the previous 6-18 months. Since the fed funds rate was the policy instrument, and since short term interest rates can always be set below long term rates, an inverted yield curve was strictly a matter of choice.
Year on year nominal GDP growth in the US fell from 6.5% in 2006Q1 to 5.3% in 2006Q3 to 4.3% in 2007Q1 to 3.1% in 2008Q1 to 2.7% in 2008Q2:
http://research.stlouisfed.org/fred2/graph/?graph_id=135856&category_id=0
Lehman Brothers filed for bankruptcy in 2008Q3. So the rate of change in nominal GDP had been falling significantly and steadily for two years before the financial crisis hit with full force.
From April 30 through October 7, 2008 the FOMC kept the fed funds rate unchanged. Inflation expectations as measured by the 5-year breakeven plunged from over 2.7% in early July to less than 1.0% by late September, indicative of the extreme stress that the economy was under:
http://research.stlouisfed.org/fred2/graph/?graph_id=91550&category_id=0
Mark –
I always appreciate your thoughtful and detailed comments. Thanks for pointing out the proper inflation measure. But I don’t see radically different behavior after the beginning of ’07. Though the gap is variable throughout ’08, the two measures had mostly similar behavior during the period in question. They start to diverge slightly in July and August, but at the time of the FED meetings, that was very new news.
You make a number of good points in your 2nd comment, which address what the Fed did and didn’t do. But they don’t address what the Fed did or didn’t say, which is what I’m getting at.
Cheers!
JzB
JimH –
I don’t think there’s anything there that I can disagree with.
JzB
“I have a hard time accepting this ignore what I do, pay attention to what I say [or don’t say] argument.”
In my opinion this mischaracterizes what David Beckworth is saying. He’s saying that the Fed needed to do more than mere actions. It needed to clearly communicate its intentions, and it needed to communicate the *right* intentions.
“It has to assume that people are deciding their actions by thinking months or years into the future based on what they think the Fed might do then, instead of reacting to what is happening today. Maybe I’m just disoriented by the time travel, but in a world where the major focus is on the current quarter’s returns, I don’t think very many actual people behave that way. Nor do I believe that the hoi polloi have even the vaguest awareness of Fed activities, let alone their words.”
Private physical investment is sensitive to expectations of growth and is vulnerable to changes or even proposed changes in monetary policy. It *is* the volatile component of GDP whose decrease *is* the immediate cause of recessions:
http://www.applet-magic.com/recessioncause2.htm
Private physical investment decisions are largely made by corporations, not the hoi polloi.
“The Market Monetarist response, from Marcus is, “Interest rates are a terrible (even misleading) indicator of the stance of monetary policy.“ At his article linked in the first paragraph of this post, Marcus indicates that the true stance of monetary policy is the resulting growth in NGDP – which I believe, as post-hoc as it may be, is the axiom on which Market Monitarism rests.”
This is precisely why we need market based measures of NGDP expectations, just as we already have for inflation expectations. Unfortunately the nearest substitute is the Survey of Professional Forecasters (SPF) which only comes out every three months, and probably is far less sensitive than a market base measure would be.
The median forecast for one year NGDP growth by the SPF peaked at 5.8% in 2003Q4. It consistently fell below 5.5% by 2006Q1 and below 5.0% by 2007Q3. It fell from 4.50% in May to 4.08% in August 2008. This was the largest decline since the 0.43 point decline in 2004Q1 when the forecasted one year NGDP growth rate was much higher.
By November 17 the one year NGDP forecast had fallen to 2.59%, a decline of 1.49 points. That is the largest decline ever in the one year NGDP forecast by the SPF on records going back to 1968. It was also a full 1.15 points below the previous record low in one year NGDP expectations of 3.74% in 1998Q4.
How much of that decline occured between August 12 when the 2008Q3 forecast was made and the September 16 FOMC meeting is hard to say. But if inflation expectations as measured by TIPS spreads are any indication, the decline was evenly distributed throughout those three months. So NGDP expectations probably had been falling at the fastest rate on record for over a month from an already low level, but there was no direct way of knowing this at the time.
Here’s a potential narrative:
Since the Fed is prone to inflation phobia, its occasional errors on the side of tighter monetary policy come from time to time. Since monetary policy had been tight since at least 2006 (base growth falls precipitously), any particular meeting where an inflation-averse error was made (e.g. September 2008) could trigger a fall in NGDP.
Imagine the tight money policy since at least 2006 as building snow pack and the September 2008 meeting as the loud noise that triggered the avalanche.
Or the tight money policy as Wile E Coyote running in the air and the September 2008 meeting was the point where the economy looked down.
It doesn’t appear that base growth alone can account for it though — an ISLM model is required to get enough oomph from a lack of change in interest rates.
http://informationtransfereconomics.blogspot.com/2014/02/the-fed-caused-great-recession.html
“But there are other reasons to disagree. Krugman provides two. First, “We were in the midst of an epic housing bust, which was in turn causing a collapse in the value of mortgage-backed securities, which in turn was causing a collapse of confidence in financial firms.” This strikes me as being a market failure, aided and abetted [if not actually caused] by weak lending standards and lax regulation, and thus totally outside the realm of anything that can be effected by either setting or talking about interest rates, especially after the fact.”
For this, I’m going to turn over the microphone to David Glasner:
http://uneasymoney.com/2014/03/04/why-fed-inflation-phobia-mattered/
“The first argument is not in my view very compelling, because the Fed’s inflation-phobia did not suddenly appear at the September 2008 FOMC meeting, or even at the June meeting, though, to be sure, its pathological nature at those meetings does have a certain breathtaking quality; it had already been operating for a long time before that. If you look at the St. Louis Fed’s statistics on the monetary base, you will find that the previous recession in 2001 had been preceded in 2000 by a drop of 3.6% in the monetary base. To promote recovery, the Fed increased the monetary base in 2001 (partly accommodating the increased demand for money characteristic of recessions) by 8.5%. The monetary base subsequently grew by 7% in 2002, 5.2% in 2003, 4.4% in 2004, 3.2% in 2005, 2.6% in 2006, and a mere 1.2% in 2007.
The housing bubble burst in 2006, but the Fed was evidently determined to squeeze inflation out of the system, as if trying to atone for its sins in allowing the housing bubble in the first place. From January to September 10, 2008, the monetary base increased by 3.3%. Again, because the demand for money typically increases in recessions, one cannot infer from the slight increase in the rate of growth of the monetary base in 2008 over 2006 and 2007 that the Fed was easing its policy stance. (On this issue, see my concluding paragraph.) The point is that for at least three years before the crash, the Fed, in its anti-inflationary zelotry, had been gradually tightening the monetary-policy screws. So it is simply incorrect to suggest that there was no link between the policy stance of the Fed and the state of the economy. If the Fed had moderated its stance in 2008 in response to ample evidence that the economy was slowing, there is good reason to think that the economy would not have contracted as rapidly as it did, starting, even before the Lehman collapse, in the third quarter of 2008, when, we now know, the economy had already begun one of the sharpest contractions of the entire post World War II era.”
“Second, “what we actually know is that the panic was in fact fairly short-lived, ending in the spring of 2009. . . . Yet the economy didn’t come roaring back, and in fact still hasn’t. Why? Because the housing bust and the overhang of household debt are huge drags on demand, even if there isn’t a panic in the financial market.” Again, it doesn’t seem likely that Fed action or words would have any effect on this outcome.”
I beg your pardon if I may again quote David Glasner.
http://uneasymoney.com/2014/03/04/why-fed-inflation-phobia-mattered/
“As for Krugman’s second argument, I believe it is a mistake to confuse a financial panic with a recession. A financial panic is an acute breakdown of the financial system, always associated with a period of monetary stringency when demands for liquidity cannot be satisfied owing to a contagious loss of confidence in the solvency of borrowers and lenders. The crisis is typically precipitated by a too aggressive tightening of monetary conditions by the monetary authority seeking to rein in inflationary pressures. The loss of confidence is thus not a feature of every business-cycle downturn, and its restoration no guarantee of a recovery. (See my post on Hawtrey and financial crises.)
http://uneasymoney.com/2013/11/06/hawtreys-good-and-bad-trade-part-x-financial-crises-and-asset-crashes/
A recovery requires an increase aggregate demand, which is the responsibility of those in charge of monetary policy and fiscal policy. I confess to a measure of surprise that the author of End This Depression Now would require a reminder about that from me.”
Mark –
I have to leave for a rehearsal in a few minutes. Probably won’t read your comments and respond until tomorrow.
Cheers!
JzB
Jazz, and maybe Mark
i am a little uneasy about the focus of this debate. i am completely ignorant of economics so no doubt i utterly fail to understand what you are talking about.
but i’d add some factors into the equation… the unwillingness of banks to lend to each other because they no longer trusted each other.
the sudden impoverization of people whose mortgages were foreclosed.
the loss of faith by those people in the honesty of either the banks or the government.
i am guessing… as an unwashed peasant, and these seem to be the people jazz at least is talking about (i think that bankers and financial players are more aware of what the Fed says than jazz thinks “the people” are, and this could make a difference)… is that if the country continues to be run by criminals, the future of America will be that of a third world country, or at best a country prosperous in the sense of the ancien regime.
there are other examples of criminal or at least predatory behavior by the powerful that i could cite. might be tedious. i am sure you can think of your own.
i don’t know if this as always been the case or if we are reaching a tipping point where the concentration of power (same as money) is reaching the point where the natural self interest of the powerful will squeeze the non-powerful until they can no longer participate meaningfully in a health economy.i have argued elsewhere that killing off Social Security as appears to be one of the goals of the current elite, will create an environment of fear in which even the elite will not be able to make money.
“He also indicated that the Fed loaned substantial amounts to financial institutions, starting early in ’08, and increasing dramatically in September and October. This is shown in Graph 8.
Graph 8 – Total Borrowings From the Fed
There was a lot of overt Fed action in 2008. Maybe it was a bit sluggish, but if so, it was only lagging real world events by a few weeks. They might have acted a bit quicker, but I don’t see any more they could have done, other than talking differently.”
The Fed initiated its credit and liquidity programs in December 2007 in response to the snowballing financial crisis. Initially these programs were fully sterilized in order to prevent the monetary base from growing. This only changed after Lehman Brothers filed for bankruptcy on September 15, 2008.
I have assembled all of the relevant data series involved in the Fed’s credit and liquidity programs here:
http://research.stlouisfed.org/fred2/graph/?graph_id=147243&category_id=0
The following is the sum of the amounts in the Fed’s credit and liquidity programs, the monetary base (SBASENS), and the difference in billions of dollars.
Date——–C&LP-Base-Diff.
2007-11-01—-0–835–835
2007-12-01—-4–836–832
2008-01-01—68–832–764
2008-02-01—77–830–753
2008-03-01—70–834–764
2008-04-01–276–830–554
2008-05-01–318–837–519
2008-06-01–324–839–516
2008-07-01–350–849–500
2008-08-01–366–849–483
2008-09-01–420–913–493
2008-10-01-1110-1113—-3
2008-11-01-1545-1459-(-86)
2008-12-01-1687-1670-(-17)
2009-01-01-1520-1715–195
2009-02-01-1331-1561–230
2009-03-01-1293-1639–346
2009-04-01-1168-1760–592
2009-05-01–974-1776–802
2009-06-01–784-1680–896
Note that the difference between the credit and liquidity programs and the monetary base didn’t recover to the level it had been in November 2007 until June 2009, just as the economy troughed.
Because these programs were initially fully sterilized, the Fed was effectively shifting liquidity away from the broader economy towards the most troubled portions of the financial sector. This is apparent if you look at the Fed’s total holdings of Treasury securities, which plunged by nearly 40% between November 2007 and June 2008:
http://research.stlouisfed.org/fred2/series/TREAST
The sterilization of the credit and liquidity programs only ended when Lehman Brothers filed for bankruptcy in mid-September.
So it is not clear to me if the Fed should be commended, or be condemned for the manner in which the credit and liquidity programs were implemented prior to when the “stuff” hit the fan as Mishkin so delicately put it.
“Further, as Stephen Williamson puts it, “So, it’s like there was a fire at City Hall, and five years later a reporter for the local rag is complaining that the floor wasn’t swept while the fire was in progress.” A bit on the snarky side, but he also points out that the Fed had lost control of the Fed Funds rate at this time, anyway, due in part to risk perceptions. This is shown in Graph 7. What does this tell us about expectations at a time of panic?”
The Problem with Graph 7, which essentially is the same graph that Williamson posted is that is the fed funds rate free of any context. Here is the same graph with the fed funds target rate and the interest on reserves (IOR) rate:
http://research.stlouisfed.org/fred2/graph/?graph_id=163024&category_id=0
The first two spikes represent the day that Lehman Brothers filed for bankruptcy and the panic in the markets that ensued two days later. Note that the fed funds rate fell below target afterwards as the Fed stopped sterilizing the credit and liquidity programs and allowed reserve balances to rise:
On October 6th the Fed announced the implementation of interest on reserves. The fed funds rate spiked above target the two following day but by the 9th it was again below target.
The institution of interest on reserves effectively set a floor on short term interest rates. Initially it was set at 0.75 points below the fed funds target rate of 1.5% or at 0.75%.
For the remainder of this story I’m going to turn the microphone over to Scott Sumner:
http://econlog.econlib.org/archives/2014/02/williamson_pull.html
“The Fed’s explanation for IOR was correctly characterized by Robert Hall and Susan Woodward as follows:
“Oddly, he [Bernanke] explained the new policy of paying 1 percent interest on reserves as a way of elevating short-term rates up to the Fed’s target level of 1 percent. This amounts to a confession of the contractionary effect of the reserve interest policy…..
…..Raising the reserve interest rate is a contractionary measure. A higher interest rate on reserves makes banks more likely to hold reserves rather than increasing lending. The Fed’s decision to raise the reserve rate from zero to 75 basis points just as the economy entered a sharp contraction in activity is utterly inexplicable. Fortunately, the Fed lowered the reserve rate subsequently, but the continuation of a positive reserve rate in today’s economy is equally inexplicable. Some economists have proposed that the Fed charge banks for holding reserves, an expansionary policy worth considering.”
BTW, I believe I was the first to propose a negative interest rate on reserves in a journal article, albeit not one Williamson reads. It’s not a cure-all, but would have helped in 2008.
Stocks fell sharply the day IOR was announced. The announcement didn’t initially attract much attention, but for what it’s worth stocks also fell sharply over the next couple of trading days. Then the Fed increased the rate of IOR on October 22nd, to 35 basis points below the fed funds target. On November 5th the Fed again raised the IOR, to equality with the fed funds target. Here’s Louis Woodhill:
“At the time of the Fed’s IOR announcement, the S&P 500 was down by a total of 12.18% from its pre-Lehman close, 15 trading days earlier. However, the day that the Fed announced IOR, the S&P 500 fell by 3.85%, and it was down by a total of 17.22% three days later.
On October 22, 2008, the Fed announced that it would increase the interest rate that it paid on reserves. The S&P 500 fell by 6.10% that day, and it was down by a total of 11.11% three days later. On November 5, 2008, the Fed announced another increase in the IOR interest rate. The S&P 500 fell by 5.27% that day, and it was down by a total of 8.60% three days later.”
The bigger problem with Williamson’s post is that he seems to assume that the primary effect of a fed funds target change is the impact of slightly lower overnight bank rates over the next 6 weeks. Or maybe he thinks that worriers like Yglesias and I think that’s the primary impact. But as Michael Woodford showed the main impact of Fed policy announcements is not from the immediate change in interest rates, but rather what it signals about the future expected path of policy…”
Countrywide Loans Mortgage Corp.—I had a friend I was visiting in 2005, a housing appraiser. One morning WE went to a house he was appraising for a bank. It was a brand new 2 story with basement at around $500,000.00+ range in a sub-division of much the same, as-far-as-the-eye-could-see sized sub-division. I sat in the truck for about an hour while he went in and measured&appraised. I was awestruck by the pure display of wealth in houses, cars, boats and toys I saw. My friend came out and was telling that this family of 4 in the house he was just in were all sitting around on bean bags or on blankets on the floor. They had no beds in the house. This appraisal was for a second mortgage to buy furniture and appliances. It was a really nice new house, I was amazed and asked, “Hey man, how often does that happen?” He said, ” They pretty much all do it.” He’d been working that sub-division for 5 or 6 years.
Mark:
“Raising the reserve interest rate is a contractionary measure. A higher interest rate on reserves makes banks more likely to hold reserves rather than increasing lending. The Fed’s decision to raise the reserve rate from zero to 75 basis points just as the economy entered a sharp contraction in activity is utterly inexplicable. Fortunately, the Fed lowered the reserve rate subsequently, but the continuation of a positive reserve rate in today’s economy is equally inexplicable.”
You sold me
Mark –
First off, thank for all your detailed and informative comments. You might have worked harder on this than I did.
@ 5:26 yesterday
I certainly don’t intend to misrepresent David Beckworth or anyone else. It is possible that I misconstrued. But I do also try to read and interpret fairly. I just reread his linked post, my comment and his response. In fairness, he does allude briefly to Fed actions of mid-’08 in the post. But the main thrust is on how signalling, not overt action, influences expectations. Regardless of the release of the transcripts, there is no new news there.
This Atlantic article is relentlessly harsh in criticizing the Fed.
http://www.theatlantic.com/business/archive/2014/02/how-the-fed-let-the-world-blow-up-in-2008/284054/
It points out in the graph under numbered item 1, that in July, ’08, 6 month forward expectations were for the FF rate to be higher by about 32 basis points. Directionally incorrect, sure, but can 32 basis points that have yet to materialize 5 years later bring down the entire economy? And this hard on the heels of a rate cut an order of magnitude larger?
If David’s response to my comment had addressed my questions about Fed actions in 2007-8, I would have written a substantially different post, or, quite possibly, none at all.
As far as I can tell, nobody else who is considering this issue has paid any attention – other than waving it away – to the fact that the FF rate was cut from over 5% to 2% in less than a year. Why do the non-actions of August and September render this irrelevant?
All your comments are very meaty, and it’s going to take some time to digest them. But I want to respond to your graph adding context to the one I borrowed from Williamson. Except for the spikes, which are brief to the point of being ephemeral, the effective FF rate was running 50 or more basis points BELOW the Fed target. As I said in the post, the Fed had lost control of the rate. And the fact that it was running low reinforces the notion that the Fed’s stance and actions were ineffective.
What this suggests to me is that in a time of crisis, the time horizon for expectations is on the order of minutes to days, not months to years.
Regarding Glassner v Krugman, I guess we should just teach the controversy.
Except for this point: “A recovery requires an increase aggregate demand, which is the responsibility of those in charge of monetary policy and fiscal policy”
I don’y think aggregate demand can recover in a big way unless and until the middle and lower classes have money to spend. Fiscal policy can help, but it’s not at all forthcoming. Folks were living on borrowings for at least a decade, and that well is dry. The need for this resulted from incomes stagnating over 4 decades, while every increment of GDP growth and productivity gains went to the top.
This is the sort of structural imbalance that is totally outside of the Fed’s sphere of influence.
Cheers!
JzB
Coberly –
You raise a number of interesting and valid points.
What the whole monetary discussion ignores is the condition of people’s wallets, the dead weight of debt overhang, and the rigged nature of the game.
JzB
Jazz
what I think I remember (aided by william greider’s Secrets of the Temple) was that in the late seventies the Fed failed to control inflation because (1) it failed to understand what money is [savings and loan accounts] and (2) that in an inflationary environment, raising the interest rate might just add fuel to the fire. Then the Fed when the inflation fighting did take hole, the Fed failed to ease the ensuing recession, because it didn’t know when to quit and didn’t “feel the pain” of the working class. instead it only quit “fighting inflation” when banks themselves began to fail.
for me this suggests that the Fed is no more able to “manage the economy” than the Soviet commissars about whom the pfree enterprisers have so much contempt.
i am not an economist or even an informed layman, but it does strike me that the debate about the Fed misses the fact that “other things being equal” are not in fact equal. an economy built around a criminal “business model” is not going to be a good place for workers, and i think in the long run won’t be good for businesses either.
has anyone studied the economics of countries controlled by an oligarchy>
As George Carlin called them, ” The Owners of this country, they own you.”
JazzBumpa,
“This Atlantic article is relentlessly harsh in criticizing the Fed.”
Just to be clear, I would say that Matt O’Brien was very critical of many members of the 2008 FOMC, and in my opinion those members deserved such criticism. We often say “the Fed” did this or that but tend to forget the Fed is run by people. Monetary policy is in the power of the 7 Board of Governors plus 5 Fed Bank Presidents in rotation, and can only be as good as the people in those positions.
JazzBumpa,
“It points out in the graph under numbered item 1, that in July, ’08, 6 month forward expectations were for the FF rate to be higher by about 32 basis points. Directionally incorrect, sure, but can 32 basis points that have yet to materialize 5 years later bring down the entire economy? And this hard on the heels of a rate cut an order of magnitude larger? If David’s response to my comment had addressed my questions about Fed actions in 2007-8, I would have written a substantially different post, or, quite possibly, none at all. As far as I can tell, nobody else who is considering this issue has paid any attention – other than waving it away – to the fact that the FF rate was cut from over 5% to 2% in less than a year. Why do the non-actions of August and September render this irrelevant?”
As Marcus Nunes pointed out, by themselves nominal interest rates are an absolutely terrible indicator of monetary policy stance. The fact that the fed funds rate was reduced does not in and of itself make monetary policy expansionary. It needs to be compared to the neutral rate which unfortunately is not directly observable. Based on the fact that both NGDP and NGDP expectations were falling from early 2006 on through late 2008, it’s a safe bet that the neutral rate was below the fed funds rate throughout that entire time period and was itself falling.
If for example the neutral rate was 3%, dropping the fed funds rate from 5% to 4% no more made monetary policy expansionary than if it had been dropped from 50% to 40%. It was still too high causing the rate of nominal income growth to slow and bring down the neutral rate still further.
JazzBumpa,
“All your comments are very meaty, and it’s going to take some time to digest them. But I want to respond to your graph adding context to the one I borrowed from Williamson. Except for the spikes, which are brief to the point of being ephemeral, the effective FF rate was running 50 or more basis points BELOW the Fed target. As I said in the post, the Fed had lost control of the rate. And the fact that it was running low reinforces the notion that the Fed’s stance and actions were ineffective.”
The point of my version of that graph was to show that the Fed lost the ability to keep the fed funds rate at target after Lehman Brothers filed for bankruptcy precisely because the target was far too high, and after losing the ability to keep the fed funds rate at that too high target level it compounded matters by instituting interest on reserves in a bizarre counterproductive effort to hold short term interest rates up no matter what the consequences. We can be reasonably sure that these efforts were contractionary in part because every time the Fed took action to do so the stock market took another dive.
JazzBumpa,
“I don’y think aggregate demand can recover in a big way unless and until the middle and lower classes have money to spend. Fiscal policy can help, but it’s not at all forthcoming. Folks were living on borrowings for at least a decade, and that well is dry. The need for this resulted from incomes stagnating over 4 decades, while every increment of GDP growth and productivity gains went to the top. This is the sort of structural imbalance that is totally outside of the Fed’s sphere of influence.”
This sounds like you subscribe to some version of the underconsumption hypothesis, which I would suggest is a highly implausible theory. First, there’s no evidence that those with wealth or high incomes save any more out of the income that they derive from the production of new goods and services than anybody else. Second, there’s no significant correlation between national savings rates and the rate of growth of nominal incomes.
Wealth and income inequality, as undesirable as it may be for other reasons, is not an impediment to the ability of monetary policy to generate high levels of nominal income growth.In particular there are many examples of countries in the developing world where there is extraordinary wealth and income inequality and yet the growth rates of nominal income are sufficiently high to generate unhealthy levels of inflation.
This sounds like you subscribe to some version of the underconsumption hypothesis, which I would suggest is a highly implausible theory.
If so, then I’m no worse off than legions of economists who believe in RBCT, DSGE, Rational Expectations, and the EMH, all having relationships to reality that vary between transitory and non-existent.
But that is weak tea. Here’s what I really believe. In a span of several years ca. 1980 the U. S. transitioned from secular inflation to secular disinflation, and that changed everything. There is no economic theory that holds always and everywhere. At or near the the ZIRB, which we have experienced twice already in this young century, is yet a third environment where things are again different. Comparing a mature economy in a continuing slump after decades of secular stagnation to developing countries with high rates of growth and inflation assumes a lot of ceteris paribus that might not be justified.
I believe that home price bubble equity was an ATM that grew consistently as a fraction of PCE after 1996, and accounted for over 2% in 2005 – and I got this from Greenspan and Kennedy, Table 2.
http://www.federalreserve.gov/pubs/feds/2007/200720/200720pap.pdf
Note that when this spigot got cut off, PCE in 2008 dropped by about 2.5%
http://research.stlouisfed.org/fred2/graph/?g=sSo
Equity extractions were equivalent to 6 to 8% of disposable personal income in 2005-6.
http://www.calculatedriskblog.com/2009/03/equity-extraction-data.html
I believe that someone at the subsistence level will spend the next dollar; that people at, say, twice the poverty level have unmet needs and would spend more if they could. That David Koch will spend his next dollar buying political influence, and that the multipliers are different.
First, there’s no evidence that those with wealth or high incomes save any more out of the income that they derive from the production of new goods and services than anybody else.
This is demonstrably false, as I discovered spending about 10 minutes with the Google. Look at the tables in these documents. The differences are enormous, including negative rates in at least the bottom quintile.
From the Fed: ” For households aged 30-59, we consistently find that higher lifetime income households save a larger fraction of their income than lower income households. ”
http://www.federalreserve.gov/pubs/feds/2000/200052/200052pap.pdf
UBS economists, via Business Week:
http://www.businessinsider.com/chart-savings-rate-by-income-level-2013-3
David Bunting, Journal of Post-Keynesian Economics – see Tables 1 and 3.
http://access.ewu.edu/Documents/Faculty/David%20Bunting/savings.pdf
Hugget and Venturo(illustrations missing) : “Understanding Why High Income Households Save More Than Low Income Households.”
http://www9.georgetown.edu/faculty/mh5/research/saving.pdf
Cheers!
JzB
Oops – that’s UBS Economists vis Business Insider, not Business Week.
JazzBumpa,
“I believe that home price bubble equity was an ATM that grew consistently as a fraction of PCE after 1996, and accounted for over 2% in 2005 – and I got this from Greenspan and Kennedy, Table 2…Note that when this spigot got cut off, PCE in 2008 dropped by about 2.5%…So Equity extractions were equivalent to 6 to 8% of disposable personal income in 2005-6…I believe that someone at the subsistence level will spend the next dollar; that people at, say, twice the poverty level have unmet needs and would spend more if they could. That David Koch will spend his next dollar buying political influence, and that the multipliers are different.”
The most up to date data from the Greenspan-Kennedy study can be downloaded from the Calculated Risk link that you posted. It shows that equity extraction as a percent of total PCE fell from 2.3% in 2005Q4 to 0.3% in 2008Q4. It had already fallen to 0.8% by 2007Q4 before the recession even started. Similarly net equity extractions as a percent of disposable income fell from 9.4% in 2006Q1 to (-2.2%) in 2008Q4. It had already fallen to 3.1% in 2007Q4.
Although year on year nominal PCE fell 3.2% at trough, year on year nominal private nonresidential investment fell 27.7%:
http://research.stlouisfed.org/fred2/graph/?graph_id=164620&category_id=0
More importantly, year on year nominal PCE did not fall significantly until 2008Q4 whereas year on year nominal private nonresidential investment started plunging in 2008Q1. PCE growth was 4.8%, 3.9%, 4.1% and 3.3% in 2007Q4 through 2008Q3, whereas nonresidential investment growth was 7.2%, 4.1%, 0.0% and (-2.9%) in the same four quarters.
And despite the fact that nonresidential private investment was only 13.5% of potential GDP in 2007Q4 it fell to 9.0% of potential GDP by 2009Q3 or by 4.5% of potential GDP. In contrast PCE fell from 67.2% of potential GDP in 2007Q4 to 63.1% of potential GDP in 2009Q2 or by 4.1% of potential GDP.
So nonresidential private investment fell sooner, faster and further than PCE. Moreover this happens in all recessions. What does this have to do with equity extractions or wealth and income inequality? Not a darned thing.
JazzBumpa,
The Dynan, Skinner and Zeldes (DSZ) paper uses the CEX, SCF and PSID data which produce estimated aggregate savings rates in the range of 25%, 21% and 11-21% respectively over time periods (1980s) in which the savings rate measured by the BEA was approximately 8%-9% (see Table 2). The only data that even comes close to the correct aggregate measure is the PSID measure which uses an “active” measure of savings that effectively excludes capital gains income. This is not suprising because capital gains are not, nor should they be, considered part of GDP.
The Graph the UBS economists point to comes straight from the Dynan, Skinner and Zeldes study above. Bunting relies on CEX data and hence his estimates are subject to the very same problems as Dynan, Skinner and Zeldes. Similarlly Hugget and Venturo rely on survey data, and the estimated savings rates by income level indicate its upper income savings rates are similarly outlandish.
Other studies, ones that actually produce aggregate savings rates consistent with the NIPA accounts, have shown that savings rates at times have actually been inversely related to income:
http://www.federalreserve.gov/pubs/feds/2001/200121/200121pap.pdf
This study in particular showed that the savings rate of the top quintile was negative in 2000.
JazzBumpa,
In the largest, and by most accounts, best study to date on the question of inequality and national savings, by Schmidt-Hebbel and Serven (2000), involving World Bank data on 82 countries over 1965-1994, they generally found no significant correlation between measures of income inequality and national savings.
The lone exception was in a regression that used the income share ratio of top 20% to bottom 40%. The correlation was significant at the 5% level, but was negative. In other words, it suggested that greater inequality resulted in lower national savings.
http://darp.lse.ac.uk/papersdb/Schmidt-Serven_(JDE2000).pdf
So much for the cross-sectional evidence. How about the time series evidence?
Well we all know that inequality bottomed in the US between 1968 and 1978 depending on the measure one uses (Gini Index, income ratios, income concentration etc.) and has soared since then. Since those with high incomes now have a much larger share of total income than they did in the 1970s, if those with high incomes save more than those with low incomes, obviously savings has soared, right? Wrong.
http://research.stlouisfed.org/fred2/graph/?graph_id=152807&category_id=0
Personal savings as a percent of GDP (blue line) peaked at 9.4% in 1971 and fell as low as 1.8% in 2005. It has increased since then but that is due to the recession, not to a dramatic surge in inequality.
Well maybe the rich were in effect having corporations save on their behalf (red line). It’s more volatile, but there too we see that domestic business savings as a percent of GDP peaked at 5.1% in 1965 and fell to a low of 1.1% in 2008.
Thus it’s not surprising when we sum the two, net private savings (green) fell from a high of 13.0% of GDP in 1973 to a low of 4.0% of GDP in 2007. Adding in capital consumption to make it gross private savings (orange) results in a peak of 23.2% of GDP in 1975 and a low of 16.2% in 2000.
In short, during the time that income inequality soared, savings plunged.
So both the cross sectional and the time series evidence fail to support the idea that those with high incomes save more than those with low incomes.
It’s a trivial exercise to get falling aggregate savings rates with higher rates at the top due to inequality. All it takes is negative savings rates for the non-rich.
There are plenty of newer studies showing high savings rates among the rich. TPTB have made such studies difficult , however , by making sure the appropriate data collection never occurs. The truth does out eventually , though.
Pretending to be unaware of evidence doesn’t make it go away.
Marko,
“It’s a trivial exercise to get falling aggregate savings rates with higher rates at the top due to inequality. All it takes is negative savings rates for the non-rich.”
The point is that we don’t have to guess what the NIPA consistent savings rates are by income level. Maki and Palumbo came up with the following estimates by quintile for the year 2000 (Table 2):
Top quintile : (-2.1%)
Fourth quintile : 2.6%
Middle quintile : 2.9%
Second quintile : 7.4%
Bottom quintile : 7.1%
http://www.federalreserve.gov/pubs/feds/2001/200121/200121pap.pdf
Moreover, given how concentrated income is at the upper levels it *is* something of a problem. Appendix A Table A shows that the top quintile had 44.3% of the disposable income in 2000 versus 4.4% for the bottom fifth. The personal savings rate averaged only 4.0% in 2000:
http://www.bea.gov/iTable/iTableHtml.cfm?reqid=9&step=3&isuri=1&910=x&911=0&903=58&904=2000&905=2013&906=a
Marko,
“There are plenty of newer studies showing high savings rates among the rich.”
Yes there are loads of such studies. But very few of them involve savings rates estimated in manner consistent with how the BEA’s personal savings rate is computed and how GDP is measured.
Why are savings rates even an issue ? Because if savings inequality is as distorted as we already know income inequality is , it means that the high savings of the rich will allow them to accumulate wealth – which equals power – and will thus allow them to further escalate their gains , at the expense of all the rest of us.
Wealth is just net worth. Since we don’t have robots picking up paychecks yet , GDP is the income of all of the people in the U.S. Similarly , the assets of the U.S. belong to the people , not the robots.
Thus , we can measure how wealth advances from year-to-year in the U.S. by simply looking at how the ratio of total net worth to total gdp evolves. FRED has that :
http://research.stlouisfed.org/fred2/graph/?graph_id=164657&category_id=9418#
Since 1980 , the net worth / gdp ratio has run from ~4.4 to as high as ~ 6. What does that mean ? It means that , on average , net worth had to increase at over 4.4 times the amount of gdp growth , otherwise the the ratio would have fallen over time. So , for a 500 billion nominal gdp growth in a typical year, net worth had to grow at least 2.2 trillion. If gdp grows by a trillion , net worth grows by at least 4.4 trillion. Using this relationship , if you convert a 5% ngdp growth rate to a savings rate as a % of gdp , you’re talking about 22%. And over the last 20 years , it’s been considerably more than even that.
Now who holds those assets ? The major source of wealth for the bottom 80% is housing wealth – they own very little in terms of financial assets. Owner equity in homes is only about 1X of gdp , and has been for decades. Of course , the rich own a good chunk of that as well , but even assuming they didn’t , the gain to housing equity only increases by 5% of gdp in a typical 5% ngdp growth year.
The real action is in non-housing wealth , and the rich own the bulk of that , so by definition , their savings rate – aka net worth increase rate , aka wealth increase rate , aka power consolidation rate – is many multiples of the vast majority.
This ain’t brain surgery , but it does require a brain to grasp.
Try Ebay.
“The point is that we don’t have to guess what the NIPA consistent savings rates are by income level. Maki and Palumbo came up with the following estimates by quintile for the year 2000 (Table 2):
Top quintile : (-2.1%) Fourth quintile : 2.6% Middle quintile : 2.9% Second quintile : 7.4% Bottom quintile : 7.1 ”
Please , everyone , tell me you immediately saw thru this. Please.
The year 2000??
Do you remember what happened in 2000?
Look at the Fred graph I posted above. You should write down the years when the net worth/gdp ratio is declining so you will know in the future when hacks like Palumbo are trying to tell you the rich save less than the rest of us.
Man , there’s no end to the crap…….
Mark –
So nonresidential private investment fell sooner, faster and further than PCE. Moreover this happens in all recessions. What does this have to do with equity extractions or wealth and income inequality? Not a darned thing.
Mark – I disagree with this, and will put up a separate post to show why. Probably won’t get it up before Tuesday.
Cheers!
JzB
“Why are savings rates even an issue ?”
In underconsumption theory recessions and stagnation arise due to inadequate consumer demand relative to the production of new goods and services. Consequently it is precisely the amount of savings relative to the income that is derived from the production of new goods and services that is connected to the matter of whether underconsumption is actually taking place. So changes in wealth, and the income derived from the buying and selling of assets, are completely peripheral given the very nature of underconsumption theory.
“The year 2000?? Do you remember what happened in 2000? Look at the Fred graph I posted above. You should write down the years when the net worth/gdp ratio is declining so you will know in the future when hacks like Palumbo are trying to tell you the rich save less than the rest of us.”
Yes, there was a decline in the household wealth to GDP ratio in 2000 (corporate wealth is largely irrelevant to the question of personal savings rates) but this doesn’t explain why savings out of the income derived from the production of new goods and services of those in the top quintile was unusually low that year.
Even though capital gains realizations are not income from the standpoint of NIPA, they are however relevant to the question at hand. The year 2000 was a record year for capital gains realizations as a percent of GDP (6.5%):
http://www.taxpolicycenter.org/taxfacts/displayafact.cfm?Docid=161
Typically a small portion of capital gains realizations is used in consumption, so years in which realizations are large happen to also be years when consumption by those with high incomes is high, and consequently their savings are low.
I’m not claiming that 2000 is a typical year. If you are interested the paper also reports results for 1992 in which the rankings are reversed. But the general conclusion is that there is no significant difference in savings rates by income level when computed on a NIPA basis.
I don’t think many people are going to buy into the idea that an executive can receive 20-50% or more of his total compensation as capital gains , then somehow it’s not considered savings when he socks it all away , accumulating billions in net worth over time. The NIPA treatment of capital gains has been an acknowledged flaw in this regard.
That $100-plus trillion net worth came from somewhere , and it obviously wasn’t consumed , so call it “effective savings ” if it makes you feel better. And that figure is the lowball – estimates of hidden U.S. wealth in tax havens run to the tens of trillions.
http://object.cato.org/images/pubs/commentary/reynolds-101223.jpg
I don’t think many people are going to buy into the idea that an executive can receive 20-50% or more of his total compensation as capital gains , then somehow it’s not considered savings when he socks it all away , accumulating billions in net worth over time.”
Personal income taxes are the only context where capital gains are even referred to as “income”. Capital gains only relate to the buying and selling of assets and hence are not income in the NIPA and SNA sense of that which is derived from the production of new goods and services. Referring to capital gains as income will produce a measure of savings that is wildly inflated compared to the NIPA and SNA measure of savings out of the income derived from the production of new goods and services, which is the measure of savings relevant in this context.
“The NIPA treatment of capital gains has been an acknowledged flaw in this regard.”
It depends on what you are talking about. If you are talking about GDP, which is designed to be a measure of the production of new goods and services, then this is largely false. Perhaps the largest most comprehensive review of the measurement issues involved with GDP was the 300 page Stiglitz, Sen and Fitoussi report of 2009:
http://www.stiglitz-sen-fitoussi.fr/documents/rapport_anglais.pdf
Capital gains in the context of personal income is discussed on the bottom of page 107, and the report makes no recommendations, although a footnote in that section points out that an earlier expert group recommended that capital gains be excluded from measures of personal income.
“That $100-plus trillion net worth came from somewhere , and it obviously wasn’t consumed , so call it “effective savings ” if it makes you feel better.”
Why not just call it capital gains?
Capital gains are largely a tax construct consisting of the nominal gains in asset values between asset transfers. In fact in 13 OECD countries there are little to no capital gains because in those countries capital gains are generally not taxed.
“Why not just call it capital gains? ”
Capital gains is what happened when your asset value increased. Money gains is what happened from labouring. All gain is an income logically. I know the rules don’t say this but they should IMO.
Capital gains should just be non taxable income if there is no asset sale involved.
“Personal income taxes are the only context where capital gains are even referred to as “income”. ”
Capital gains dont have to be called income if your really adamant though. The increases can be just accounted for as savings.
The fact of the matter is that the accepted definition of savings is not in dispute. What varies is how to estimate it. Everyone agrees that the following equation defines the term :
Net worth (t+1) – net worth (t) = disp. income (t+1) – consumption (t+1)
NIPA measures – rather , estimates – the right hand side. FOF estimates the left hand side. In theory , they should match to the penny , but there are obviously data collection problems that prevent this from ever happening.
The observed average net annual changes in net worth , even assuming the historical volatility in asset prices , is typically multiples of the measured savings , by either method. Why might that be ?
I can think of one reason. A savings “shortage” argues strongly for tax incentives that encourage savings and discourage consumption. So , let’s see , how about we eliminate the capital gains tax and replace it with a consumption tax ?
How convenient for the 1%. They win , again.
“….There is an alternative way of obtaining estimates for the personal saving rate using the Flow of Funds Accounts (FOFA) reported by the Federal Reserve Board. It is based on the fact that savings (income minus outlays) are simply changes in net worth…..”
http://www.clevelandfed.org/research/trends/2013/0613/01houcon.cfm
“Everyone agrees that the following equation defines the term :
Net worth (t+1) – net worth (t) = disp. income (t+1) – consumption (t+1)
NIPA measures – rather , estimates – the right hand side. FOF estimates the left hand side. In theory , they should match to the penny , but there are obviously data collection problems that prevent this from ever happening.”
Actually this equation is in general false, not only empirically, but theoretically. You will not find it anywhere in Amaral and Millington. Nor did they mean to imply that changes in net worth should equal savings out of the production of new goods and services.
The FOFA measure of savings is an alternative measure based on changes in stock, whereas the NIPA measure of savings is based on flows. There is absolutely no theoretical reason to believe that the two measures should be equal. Hendershott and Peek (1989), page 185:
“Many researchers define saving synonymously with the change in real wealth: net worth at the end of the period less net worth (revalued to current prices) at the beginning of the period. Saving, then, would be the change in real resources available for future consumption. While this change is certainly an important variable worthy of serious investigation, the ex post change in real wealth in most periods is largely the result of unexpected wealth changes (stock market gains or losses, housing and land booms, etc.). That is, the change in real wealth is generally dominated by real asset price changes, not planned decisions to increase or decrease the accumulation of wealth.”
http://www.nber.org/chapters/c8120.pdf
When, for example, a house or a painting increases in value, net worth may have gone up, but no savings out of the production of new goods and services has actually taken place.
“When, for example, a house or a painting increases in value, net worth may have gone up, but no savings out of the production of new goods and services has actually taken place. ”
Valuations of assets go up because of increased production of goods and services and gdp. Extra demand for housing or art came about as a result of increased production of goods and services. Increased production should mean increased saving if saving rate stays the same.
“the ex post change in real wealth in most periods is largely the result of unexpected wealth changes (stock market gains or losses, housing and land booms, etc.). That is, the change in real wealth is generally dominated by real asset price changes, not planned decisions to increase or decrease the accumulation of wealth.”
People buy houses or shares expecting growth in capital value or dividends/rent most of the time. People dont buy houses or shares if they dont expect a return otherwise they will just bank their money.
dannyb2b,
“The increases can be just accounted for as savings…Increased production should mean increased saving if saving rate stays the same.”
Increased wealth is not the same as savings out of the income derived from the production of new goods and services. Changes in asset values are not part of GDP.
But an increase in gdp should result in higher wealth. Higher income from gdp means higher saving if MPS stays the same right?
dannyb2b,
“Higher income from gdp means higher saving if MPS stays the same right?”
Hypothetically yes.
Isn’t it funny that NIPA considers the taxes paid on capital gains as a reduction in personal income , and a corresponding increase in gov’t income , even though those capital gains are not a component of newly-produced goods and services.
Isn’t it also funny that market monetarists are happy to tell us how the “wealth effect” acts as a transmission mechanism of monetary policy , as new consumption arises from increased financial asset values. It’s almost as if that new wealth is serving as a source of income , but no , we can’t think of it that way. NIPA , NIPA , NIPA !
The stocks vs flows discrepancy is a recognized problem , not simply an accepted feature of the accounts. Good balance sheet accounting requires that stuff doesn’t just vanish into the ether without notice. The whole purpose of the Integrated Macroecomic Accounts is to resolve these discrepancies.
With luck , maybe one day savings will be defined based on sound accounting principles , rather than in a way that furthers the interests of the rich , as they are today.
http://bea.gov//scb/pdf/2007/02%20February/0207_macro_accts.pdf
“The stocks vs flows discrepancy is a recognized problem , not simply an accepted feature of the accounts. Good balance sheet accounting requires that stuff doesn’t just vanish into the ether without notice. The whole purpose of the Integrated Macroecomic Accounts is to resolve these discrepancies.”
Actually the purpose of developing the integrated accounts is somewhat more mundane, and is clearly stated on the first page of your link:
“The full set of integrated macroeconomic accounts were developed as part of an interagency effort to further harmonize the Bureau of Economic Analysis national income and product accounts (NIPAs) and the Federal Reserve Board flow of funds accounts (FFAs) and to bring these accounts into closer accordance with the national accounting guidelines offered by the international community in the System of National Accounts, 1993 (SNA).”
In other words, the integrated accounts is simply designed to bring the idiosyncratic US accounts systems closer into alignment with the SNA, which the rest of the planet has been using in gradually evolving form since 1953. This is already making the task of comparing the US accounts with other nations dramatically easier.
Let’s look to the “background and evolution ” of the IMA , shall we ?
“1. Background and evolution
The integrated macroeconomic accounts (IMAs) were developed as part of an interagency effort to further harmonize the Bureau of Economic Analysis’s (BEA) national income and product accounts (NIPAs) and the Federal Reserve Board’s (FRB) flow of funds accounts (FFAs). Work began on these accounts in 2002 and the first version of the tables was presented at the NBER Conference on Research in Income and Wealth, Architecture for the National Accounts in April 2004, with annual data for 1985 to 2002.2 A February 2007 Survey of Current Business article officially introduced the regular production of the IMAs.3 ”
Now , how to organize such an effort ? And how to do so in a way that would contibute to efforts to harmonize with international accounts ?
“The System of National Accounts, 1993 (SNA) was used as the organizing framework in an effort to bring these accounts into closer accordance with international guidelines. ”
http://www.federalreserve.gov/pubs/feds/2012/201281/201281pap.pdf
So what’s this SNA stuff ? What concerns are being addressed there ?
“The SNA93 structure envisions separate statements for sectors of the economy. Each statement contains accounts for production, income, saving, investment, and financial flows for that sector. Those sector flow accounts are combined with information on changes in value of
assets and liabilities due to factors not related directly to production and saving. All together, the integrated accounts offer a means to track the sources of change in sectors’ net worth; the SNA93 structure begins with a balance sheet position and fully explains how that position evolves. Along the way, it provides detail on transactions, the distribution of income by factors of production, saving, capital formation, financial intermediation, and other aspects of national and
sector economic activity. ”
http://www.federalreserve.gov/pubs/feds/2004/200454/200454pap.pdf
Goodness! This is my dream come true ! Thank you for making me look this up.
It seems the goal is to resolve all those stock vs flow issues and produce a sound balance sheet where stuff actually adds up , like it’s supposed to. And they want to accurately detect changes in sectoral net worth . Great !
I bet the plutocrats’ lobbyists are working overtime to put a stop to this.
“Goodness! This is my dream come true ! Thank you for making me look this up. It seems the goal is to resolve all those stock vs flow issues and produce a sound balance sheet where stuff actually adds up , like it’s supposed to. And they want to accurately detect changes in sectoral net worth . Great ! ”
Um, SNA has been around since 1953.Glad I could clear it up.