Is the ratio of initial unemployment claims to the civilian labor force bottoming out?
Doug Short has an insightful article out today… The Civilian Labor Force, Unemployment Claims and Recession Risk.
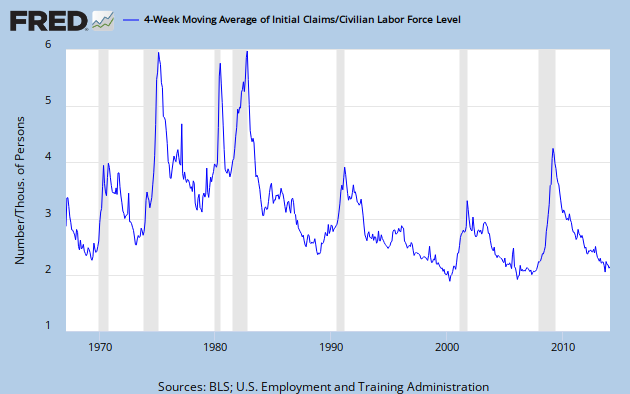
I want to highlight one graph from that article, where he plots the % ratio of initial unemployment claims to the civilian labor force.

He explains the graph…
“The latest percent ratio of 0.22% means that out of 10,000 workers, twenty-two made an initial application for unemployment insurance payments in the latest data, up from an interim low of 0.20% in September. The number during the past year has been hovering just above the low end of the 0.19% to 0.60% range over the last four-plus decades. Initial Claims are substantially below the levels during the business cycles of the stagflation years of the 1970s and early 1980s. However, as I suggest in the chart callout, we may look back on September 2013 as the business cycle low for this indicator.”
In effect, Doug Short’s graph is saying that initial claims will probably not fall much below the level we see now around 330,000 per week. Yet, there is also the implication that the plot has hit a low and may start to reverse upward. We would then start seeing higher weekly initial claims.
As you can see in this graph, once the plot hits its trough, a recession is a year or two away. This graph is one to follow in 2014. (You can follow the graph at FRED using this link.)
Edward:
Away from my usual troll detector function and saw this post of yours. Is this
“once the plot hits its trough, a recession is a year or two away.”
covered in one of your other posts?
Run75441,
No… This graph is new to me.