Does Upward Redistribution Cause Secular Stagnation?
A while back I built a model to look at the long-term economic effects of upward and downward redistribution. Posts here and here.
Commenter JGF pointed out an error in the model. I’ve revised and corrected it. The spreadsheet’s here.
The model is based on marginal propensities to spend out of wealth and income. Poor people spend more of their wealth and income each year than rich people, so if income and wealth are less concentrated, there’s more spending.
The model displays only one economic effect (there are many others, of course), and the effect is purely arithmetic. But as such, the effect is arithmetically inexorable.
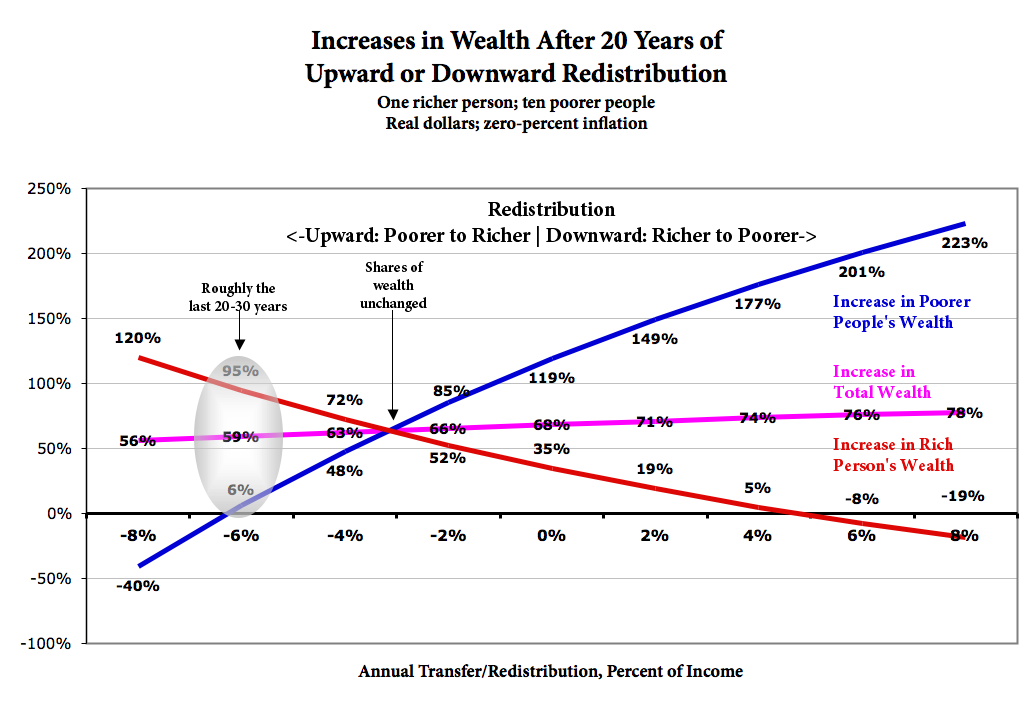
Here are the results. Explanations below.
Here it is displayed as compounded annual change:
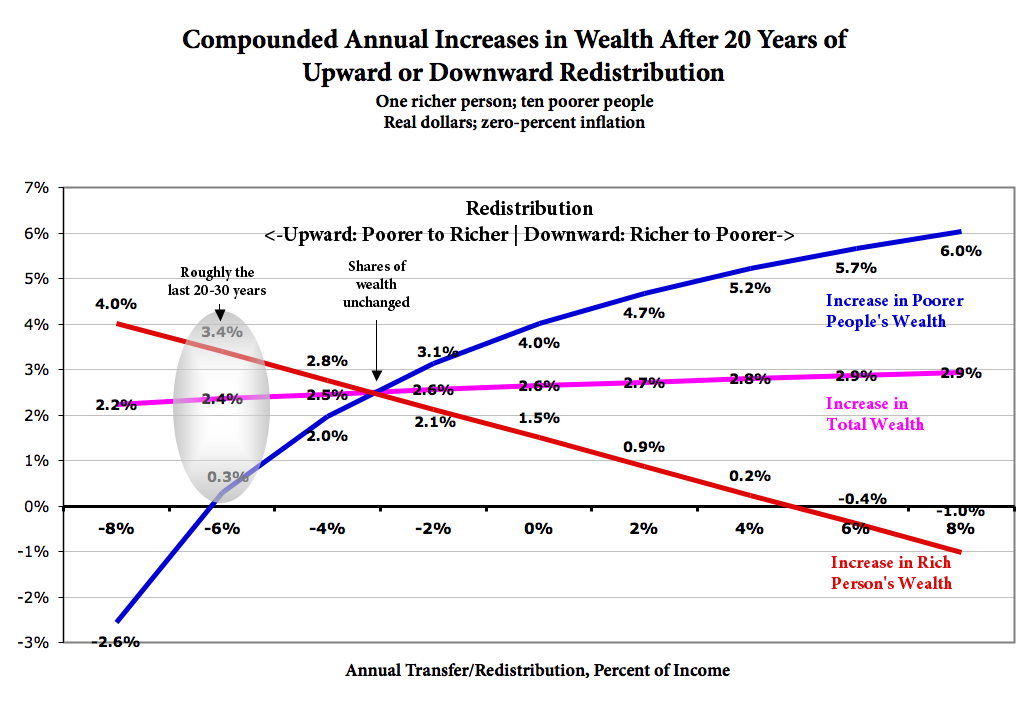
The change-in-income graphs look almost identical. (Because annual income in this model is a simple function of the previous year’s spending, and spending is a simple function of wealth.)
Short story:
• Total wealth grows in every scenario. (It’s a model of a growing economy.)
• Every individual’s wealth increases in almost every redistribution scenario. Rich and poor alike.
• Total wealth grows faster with downward redistribution.
• Poorer people’s wealth increases faster/more with more downward redistribution, and the rich people’s wealth doesn’t grow as fast. (But it still grows in most scenarios.)
• Maintaining the status quo wealth concentration requires annual upward redistribution of about 3%. For the rich to maintain their relative wealth proportion, they have to be subsidized by the poor.
• Note the exponential curves, with steep slopes on the left. The effect of upward redistribution is more powerful than downward redistribution. As upward redistribution increases, the rich get richer, faster. The poor stagnate or get poorer, faster. Ditto total wealth (though that effect is more muted). The opposite is true with downward redistribution; as it increases, the ultimate effect on end-of-period wealth gets steadily weaker.
Look at the 2% downward redistribution scenario:
• Poorer people’s wealth grows 2.5X.
• The richer person’s wealth (only) increases 1.2X.
• Total wealth grows 1.7X, compared to 1.65X in the status-quo scenario.
Is this Pareto efficient/Pareto optimal, “a state of allocation of resources in which it is impossible to make any one individual better off without making at least one individual worse off”?
It depends on your counterfactual. “Worse off” compared to what? Compared to Year One, or compared to a different redistribution percentage?
Everybody’s better off than Year One at almost every redistribution percentage. The rich person is less better off with downward redistribution than they’d be with upward distribution. But they’re not worse off than they were at the beginning.
Meanwhile the poorer people are much better off with downward redistribution, and “everyone” is also better off. You decide.
Explanation of the Model
Spending drives production. In an 80%-service economy where many real goods are produced just-in-time, if you don’t spend, it doesn’t get produced. (Think: massages and iPhones.)
Production delivers a surplus. More value comes out than goes in. In this model as displayed the surplus is 5%. (This results in an average 3.3% annual increase in incomes/spending/GDP at 0% redistribution.)
More spending causes more production, so more surplus, so faster growth.
There is one richer person starting with 60% of the wealth, and ten poorer people starting with 4% each–40% total. (In the U.S. today, the top ten percent hold roughly 60-65% of the wealth.)
The rich person spends 30% of their wealth annually. The poorer people spend 80%.
Everyone receives all the resulting income in proportion to their spending. So everyone gets more income and wealth every year. (There’s that 5% surplus from production. The economy is growing steadily.)
Some percent of income is transferred, redistributed, every year — upward from the poorer people to the richer person, or vice versa.
The model doesn’t consider how the redistribution takes place — what forms it takes (explicit transfers and subsidies, labor vs. investment tax rates, minimum-wage laws, free public education and health care, whatever). Rather it just looks at the results of upward and downward redistribution, and the resulting wealth and income growth, and concentration versus diffusion.
Assumptions. This model, I believe, makes only five assumptions:
Economic assumptions (you can change these numbers in the model):
1. Production yields a 5% surplus, which is transformed into monetary income via the magic of the private/central-bank/government financial system. Praised be the Lord. That production/transformation process is a black box.
2. Spending is a function of wealth. Rich people spend 30% of their wealth each year; poor people spend 80%. Since income is a function of wealth in this model, income and spending maintain a plausible relationship for all agents at all wealth levels. A more sophisticated consumption/spending function would incorporate interacting functions for spending out of income and spending out of wealth. But #3, below, would remain generally true.
Behavioral assumptions:
3. Rich people spend a smaller percentage of their wealth each year than poor people. (Declining marginal propensity to spend out of wealth.)
4. Producers respond to increased spending by increasing production. (Not prices — there’s zero percent inflation.)
5. There are no other behavioral effects.
Of course, there are other behavioral effects. Incentives matter, blah blah blah. And there is price and wage inflation. To repeat: This model displays just one, purely arithmetic effect. But as such, that effect is arithmetically inexorable.
The picture changes when you change the variables for the economic assumptions. The crossing point moves, and the curves change, but the basic shape doesn’t. I encourage my gentle readers to download the spreadsheet and run it through its paces.
Cross-posted at Asymptosis.
“Production yields a 5% surplus, which is transformed into monetary income”
This is an assumption with which I have been having trouble lately – at least for a closed system. Perhaps it is just because I can’t make sense of it in a single good model that economist’s seem to like so much.
Assume production is all in corn. Unless the population is growing or the surplus can be exported, the surplus will eventually have no real value and the economy will not grow any more.
Assume production is all in widgets. As long as someone keeps inventing new widgets the economy can grow, but in that case the growth comes not from surplus production, but from invention. As the economy moves towards service, growth rate will shrink.
I think I need to read more on the subject of economic growth. Any suggestions?
Arne, the surplus is in value, not corn. That value is 1. monetized by the financial system, and 2. that is transformed into real, lasting assets — fixed, human, etc.
Surplus corn= whiskey, a solid winner EVERY time and on SOME days, worth more than gold.