More Reflections on the Circular Flow of National Income
After posting an article about how imports create saving for investment, a conversation was started. The conversation led to doing more research and developing new explanations to understand the basic circular flow model. This is actually a very important issue to get right. The circular flow is such a basic part of understanding the economy.
Normal Flow diagrams are misleading

The Logic Puzzle to determine GDP
I am going to present a logic puzzle for equilibrium GDP (Y). I take out the government sector, because we just want to see the relationship between gross savings, investment, imports and exports. The debate that resulted after my last post led me to create this logic puzzle.
The puzzle sets up the correct equations in a flow format with GDP income being used in the first line, where you see consumption, gross saving and imports. The equation for the first line is Y = C + S – M, version of equation (4) without net taxes (T). Then you see the spending that returns to firms as GDP on the last line, where you see consumption, investment and net exports. The last line simulates the correct official equation for Y = C + I + NX, version of equation (5) without G.
In the first column, you have household consumption. In the second column, you have the financial sector which makes sure money goes to where it needs to go. In the third column, you have the foreign sector, where imports and exports are traded.

There are constraints to the right.
- Imports must be negative. If there were positive, they would be an export and would be moved to the exports box.
- Exports must be positive. If they were negative, they would have to be put in imports.
- The middle line where transfers of funds are made must equal zero, because this line is added to the first line, and the first line must equal the last line. Remember, this puzzle is for GDP in equilibrium. GDP does now change.
- Consumption does not change from the first line to the last line. Remember that consumption includes money spent on imports.
- The first and the last lines must equal GDP.
In graph #2, you see a basic example without imports and exports. $900 of GDP is given with $800 going to consumption and $100 going to gross saving. The gross saving funds are moved straight down and spent as investment in the firms. Consumption and investment in the last line equal $900 again. The economy is in equilibrium and could continue on like this.
Now we put the puzzle to the test.
Given the numbers in black, how can you determine gross saving?

In the first line, you can see how the $900 of GDP is being used. $800 is being spent. $100 of that $800 is being spent on imports. Thus, $700 is being spent on “domestic” consumption.
Now, one might think that since $800 is being spent, there must be $100 of saving left over. But realize that this $100 is only personal saving. Keep in mind that there might be another form of saving. Here is what the puzzle would look like if you put the $100 of personal saving in gross saving.

So if you just put $100 in gross saving, the first line would add up to only $800, which violates the constraint for the equation, Y = C + S – M. Also, the middle line adds up to $100 (lend/borrow 0 + exports 100), which violates the constraint that the middle line must add up to zero. We know that there must be an accounting identity missing if the middle line does not add up to zero.
The first thing then is to make the first line add up to GDP, $900. So you know that Gross Saving is going to have to be $200 in order to satisfy the constraint of the equation Y = C + S – M. …. $900 = $800 + $200 – $100. Then you know that “lend/borrow” is going to have to equal -$100 in order for the middle line to add up to zero.
Here is what the solution looks like.

You can see that an extra $100 was added into gross saving and -$100 was put into the box for “lend/borrow”. These additions are the opposites of the numbers put into imports and exports. $100 extra into gross saving balances -$100 of imports. -$100 of lending balances $100 of exports. Thus, the solution requires that you make equal and opposite entries in saving and lend/borrow for the numbers entered for imports and exports. Gross Saving adds together $100 in personal saving plus $100 of some other type of saving.
What is that other type of saving? As I tried to explain in the previous post, imports create a saving in the financial sector. To show this, solve the following logic puzzle…


It is very important to understand the circular flow correctly since it is an essential foundation of understanding the economy. One must be clear about many things, including the definition of consumption, the role of the financial sector, the funds created in the financial sector when we buy imports and the required accounting identities to make it all balance.
The circular flow diagrams that you see in probably all textbooks are ultimately misleading in one way or another.
Note: I did a search for any flow diagram put to numbers. I change the search parameters many ways. And I only found one circular flow put to numbers in an accounting type style. And it was the one I just published last week. I am now wondering how prevalent the misunderstandings about the circular flow are.
Totally neat! It’s great to see this, but you can’t really be talking about flow. You must be talking about accounting balance. Otherwise, there would be no mechanism for economic growth. (The growth problem is surprisingly tricky from an accounting point of view.)
Also, remember that the US dollar is used as a reserve currency in a lot of the world, so there are lots of dollars spent on imports that are being used as currency in other economic systems, even if their local currency is different. Also, there is the huge stash of US dollars held offshore in a variety of black and gray markets. After all, even if your local currency is the potato, you have to buy oil in dollars. (This is a big problem for dominant empires. Look at the later Roman cash shortages and various “dilution” schemes.)
Not neat.
EL’s definitions of “Saving” and “lending/borrowing” do not correspond to the normal definitions. That’s why his accounting identities differ from the usual accounting identities.
For example, EL writes:
“It would seem then these equations are equal, but they are not…
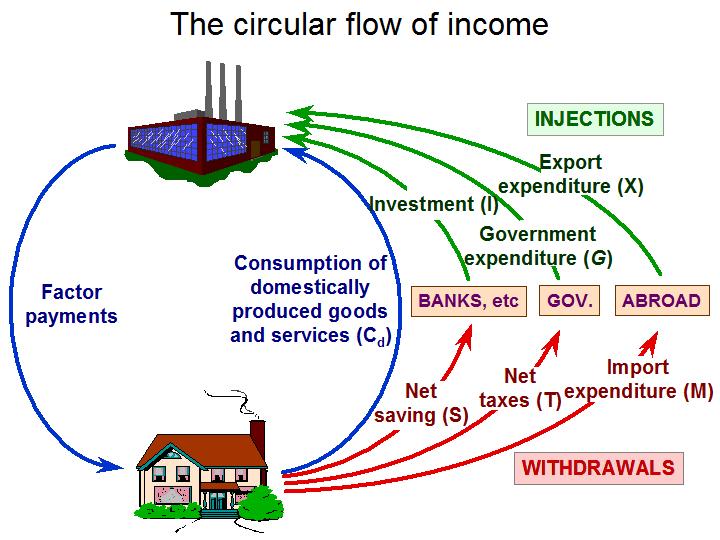
GDP flowing out = C + S + T + M”
But this is NOT at all what it would seem from the figure. The figure says Cd, not C. It is simply wrong to say otherwise.
If we call Cm the domestic consumption of foreign goods, then by adding Cm to both sides the figure says
Y+Cm = (Cd+Cm) + S + T + M = C + S + T + M
Y+Cm = (Cd+Cm) + I + G + X = C + I + G + X = Y + M
The latter (Y+Cm = Y+M) implies that Cm = M, so implicitly, all imports are consumed.
Hence, the first equation is more familiar:
Y = C + S + T
or,
S = Y-C-T = I+(X-M)+(G-T)
That is what the figure tells us.
By the way, the answer to EL’s puzzle is that his S in “Y=C+S-M” is different from the S in the figure above.
EL’s “Saving” is S+M in the usual accounting. Because he adds in an extra M to “Saving” then the usual “Y=C+S” must become “Y=C+’Saving’-M” to work out right.
By implication (going down the middle) his “lend/borrow” is I-S-M. And therefore (going across the middle) I-S-M+X = 0.
In other words… S-I = X-M. (Duh)
There’s nothing puzzling here except why EL is labeling his variables in this misleading manner.
Kaleberg,
Yes, the model is set up to show an equilibrium. But you just maintain the same principles of the model as you change it to a disequilibrium state. You allow for more injections beyond the equilibrium state and Voila, you have your economic growth.
And like you say, the US dollar moves into all kinds of “Shady” regions of the global economy. But somehow they get the national income accounts to balance. It would be pretty amazing to look under the hood at how US dollars really move and how they find a way to arrive at a Balance of Payments.
DR,
If you add imports (M) to the equation to determine domestic goods, you will not get good accounting. The equation has to factor in the US dollars that stay in the circular flow. You have to make sure that those dollars don’t disappear in your equation. And those dollars are present in my equation, that is why the accounting works out perfect.
You only need to know that my view of Saving is personal saving plus the US dollars accumulated in the financial sector from imports. You have to make sure those dollars don’t disappear…
In your second comment, you put “the usual “Y=C+S”. This equation implies that C = consumption of only domestic goods. But C is consumption of domestic goods and imported goods. Then when you say you need “Y=C+’Saving’-M” to make it work out right, you are still implying that C is only for domestically produced goods. That equation solves to…
Y = C + personal saving, where C is consumption of domestically produced goods. This equation is not going to cut the mustard.
The full equation for accounting identities must be…
Y = C + T + S – M
Where C = consumption of domestic goods (Cd) and imported goods (M).
Where S = personal saving (s) and accumulated dollars from imports (M).
Full equation writes like this…
Y = (Cd+M)+T+(s+M)-M
Equation simplifies to…
Y = (Cd+M)+T+s
But you have to be careful of this simplified equation, because the accumulated dollars in the financial sector from imports have disappeared from it.
Then the final equation of GDP returning to firms is…
Y=(Cd+M)+G+I+X-M
Now the two equations must equal for domestic production…
(Cd+M)+T+(s+M)-M = (Cd+M)+G+I+X-M
This simplifies to…
T+(s+M) = G+I+X
s-I = (X-M) + (G-T)
So you still get your equation, but you need to realize that your equation only factors in personal saving of people, not gross saving which includes accumulated US dollars in the financial sector from imports.
If you factor in those funds, which should not disappear from the equation, then you get what i have been saying…
like this…
(Cd+M)+T+(s+M)-M = (Cd+M)+G+I+X-M
simplify…
T+(s+M) = G+I+X
Now I say that (s+M) = S…. gross national saving
Now the equaiton looks like this…
T+S = G+I+X
(S-I) = (G-T) + X
Thus, Imports directly increase gross national saving (S) dollar for dollar, S = s+M.
Edward,
This writing looks like a very interesting and enlightening post. Unfortunately I have got hung up on graph #1, your first equation in particular. I hope you can point out where I am going wrong, or what I have misinterpreted.
Lets start with your first equation. According the graph #1
GDP flowing out = C + S + T + M (1)
Based on the figure C is really Cd, so equation 1 should be written as:
GDP flowing out = Cd + S + T + M (2)
Furthermore you stated that C really is
C = Cd + M (3)
or
Cd = C – M (4)
So, substituting equation 4 into equation 2, we get,
GDP flowing out = (C-M) +S +T – M (5)
or
GDP flowing out = C +S + T (6)
M is included as part of C.
My equation is in conflict with your third equation
GDP flowing out = C + S + T – M
which you say is the correct and official equation.
What am I missing or misinterpreting?
Basically I am having a problem with how you go from your equation 1 to your equation 3. I have shown my path. What is yours?
Thank you for your time. I am finding this very interesting.
Jerry,
I made changes to the first part of the post according to your comments. it should be better to understand now.
Your equation (5) in your comment should read…
GDP flowing out = (C-M) +S +T + M (5)
Check the corrected post, and see if it makes more sense now.
EL:
I’m going to repeat myself. Your accounting works out fine because you changed the definitions of the variables. Your identities contain EXACTLY the same information as standard accounting identities. The only reason they look different is because you call S something unusual.
Your S is NOT gross domestic private savings.
You write:
“In your second comment, you put “the usual “Y=C+S”. This equation implies that C = consumption of only domestic goods. But C is consumption of domestic goods and imported goods.”
NO! A thousand times, no! It does not imply C is only domestic goods. It’s exactly the opposite. With government, S is ***BY DEFINTION*** Y-C-T.
Should I even bother reading the rest of your post?
EL:
S is NOT in general gross national saving unless you have a closed economy.
S is (usually) gross domestic private saving, defined as Y-T-C.
Thus, gross national saving is (usually) defined as (Y-T-C)+(T-G) = Y-C-G = I+X-M
EL:
You wrote:
“you need to realize that your equation only factors in personal saving of people, not gross saving which includes accumulated US dollars in the financial sector from imports.”
But this is nonsense. The U.S. does NOT accumulate dollars in the financial sector when it imports. That’s utterly and completely ridiculous. At its most basic, the U.S. must trade AWAY dollars for foreign currency in order to import. Technically, I believe banks may also destroy dollar-denominated assets and create assets denominated in foreign currency.
To the extent that the dollars leave or are destroyed, there is NOTHING which dictates that they must come back. Ever. Foreigners could literally burn $100 bills. In fact, THAT would be a plus to domestic savings. (A fall in foreign-held U.S. assets means a fall in the capital account, and must be balanced by an increase in the U.S. current account.)
It’s complete nonsense to suggest that exported dollars should count toward DOMESTIC savings, and even if it wasn’t nonsense then at the very least then exports must count against it.
You are still folding (part of) the foreign financial sector into domestic financial sector. Import dollars not owned by people within the U.S. and therefore cannot be counted toward domestic savings.
To be clear, when I wrote “exported dollars” in the second-to-last paragraph, I mean “dollars sent into foreign ownership” not “dollars used to purchase exports.” That is, exporting the dollars themselves…
EL:
In going from (1) to (3) you double-counted M.
Start with
Y = Cd + S + T + M
If you think Cd is confusing, and want to put it in terms of C, then the fact that C = Cd+M means that Cd = C-M, or
Y = (C-M) + S + T + M = C + S + T
At this point, you are DONE.
DR,
If the C in this equation “Y=C+S” includes imports, Then it is including imports in Y. And since Y only refers to domestically produced goods, the equation must imply that C only includes consumption of domestic goods.
I agree, the US does not accumulate dollars in the financial sector when it imports. Like I say, foreign entities accumulate those dollars. However, those dollars do not leave the circular flow. They still belong to the US economy. So they have to be accounted for in the circular flow. Where does your version of the equations account for those dollars?
DR,
You are spinning in circles… This equation…
Y = Cd + S + T + M
matches the diagram in graph #1.
But like I say, you have to be careful from an accounting standpoint to make imports “additive” toward domestic production. The accounting will not come out right. Consumption must include imports, thus Imports must be subtracted along with additional entries. That is what the logic puzzle shows.
The government cannot determine Cd directly. It must add up all consumption, and then subtract out imports. But if you leave it at that, the accounting will still not balance. So you have to make additional entries to show where the US dollars for imports have gone and what happens to them. That is what I am showing. They end up sitting in the financial sector, which is the middle column above. From there they can be invested in the US government, invested in US business or just used for US exports.
EL:
Again, no.
“If the C in this equation “Y=C+S” includes imports, Then it is including imports in Y. And since Y only refers to domestically produced goods, the equation must imply that C only includes consumption of domestic goods.”
S includes imports. More specifically, ALL of C counts against it. So if you raise C above Cd by raising M, then S falls. So Y is unchanged.
Those dollars LEAVE the U.S. economy. They may come back, but they need not come back into the domestic flow. They may remain a liability forever. They are accounted for in the circular flow via the capital account. That is, the FOREIGN SECTOR. Which is NOT part of the U.S. economy.
A trade deficit shows up in the circular flow as a net sink of funds flowing through the foreign sector. That is, they accumulate in the foreign sector.
Edward,
I am still having a problem.
First of all, my equation 5 and your “corrected” version are the same because the “M” cancels out in your version giving my version.
Secondly, shouldn’t your equation 1 equal your equation 3?
EL:
If you believe
Y = Cd+S+T+M
and you also believe
C = Cd+M
Then you also believe
Y = C+S+T
Period. End of story. So which do you NOT believe?
Edward,
One more thing. ( I hit Post Comment too soon.)
Starting with your equation 1
GDP flow out = Cd + S + T +M
Rearranging the equation, we get
GDP flow out = Cd + M + S + T
GDP flow out = (Cd + M) + S + T
Which is equal to
GDP flow out = C + S + T
which should be your equation 3, shouldn’t it? Either that, or your equations 1 and 3 are not supposed to be equal.
EL says:
“They end up sitting in the financial sector, which is the middle column above.”
Right. Because you have mixed up domestic and foreign financial sectors. The dollars are in the foreign sector, financial or otherwise. But we generally want to know what’s going on with the domestic financial sector.
The “import” dollars you think belong in the “lending/” cell actually belong in the cell to the right, which should be “net exports.” That’s where they go.
And everything works out, because then what you have listed as “Saving” is lower by the amount of imports. And this works out in the labor income equation, because though Savings are reduced, you don’t subtract out the imports.
(FWIW, this also means that “Imports” above “Exports” is also superfluous. That should read “0”)
It looks like D R and I are asking the same question.
Jerry,
Things quieted down around here, and I made some further revisions.
Equation (1) and (3) are the same.
Cd + s + T + M (1)
(Cd + M) + s + T (3)
S in those equations is supposed to be small case s for personal savings. I made that clarification.
Check the first part. It should make sense now. Sorry for the revisions.
This make no sense.
You simply decide to add imports to savings, and subtract it out later. WHY?
The implication is that households send both their actual savings and also money marked for imports into the DOMESTIC BANKING sector. But those funds already went to the FOREIGN sector.
Where does the HOUSEHOLD sector get an extra $M to send to DOMESTIC BANKING whenever it sends $M to the FOREIGN sector?
And how come the FOREIGN sector doesn’t drain dollars from DOMESTIC BANKING in order to pay for exports? At the very least, you need another flow from DOMESTIC BANKING to the FOREIGN sector.
Even if you assert that foreigners hold their import earnings in domestic, dollar-denominated deposit accounts, then those funds are still NOT domestic private savings, so when you compute gross domestic savings, you have to take that amount out (or net imports if you count the export flows as well)
By your logic, domestic private savings S = (s+M)-M
Let’s see if I can sum up your argument
1. Increased imports create funds for domestic banks (though these additional funds do not count toward national savings, as there is a corresponding liability owed to foreigners.)
2. To the extent that domestic banks increase investment as a result of these additional funds, there Y and S increase.
3. To the extent that Y increases, s increases….
The question becomes… do banks actually increase investment in response to an increase in imports? And if so, do they actually NOT decrease investment in response to an increase in exports?
I would think it’s exactly the other way around. I would think that an increase in exports– that is, increased demand for domestic goods– would spur investment, while an increase in imports– increased demand for foreign goods– would diminish investment.
DR,
Imports are added to Cd. Then imports must be subtracted later to eventually determine net exports. But as you subtract out imports, you have to add the amount back in to keep the equation balanced. So the import dollars go to saving.
The import saving does not go into households. It goes into the financial sector. We talked about whether the import saving comes from households or business. But either way, it ends up in the financial sector.
In your last comment where you are summarizing…
1) import dollars do not leave the circular flow for US dollars. The US dollars owned by foreign entities could be in a US bank or in a foreign bank. But those dollars are still part of the US economy circular flow.
2) Domestic banks don’t necessarily have to get involved when US import dollars are invested in the US. Anyway, Y does not increase with an increase in imports. Gross saving dollars will increase and make more funds available for the US government, US investment or more exports. But an increase in Y will not increase Y, in fact it lowers consumption of US finished goods, and puts the balance in favor of investment dollars.
3) If Y does not increase with an increase in imports. And s will not increase unless total household consumption (C) decreases enough in relation to income to free up extra savings for households.
4) Investment from foreigners in the US economy will increase as the trade deficit widens. If the US can raise exports, the financial sector will have less power.
5) And you are right, an increase in exports would spur real investment in productive capacity. If exports are weak the investment of those import dollars is more likely to create unproductive bubbles in investment. This must be part of the reason why the government is trying to push an increase in exports. But my reasoning ways that labor income must rise in order for domestic demand to free up production.
We have an economy that is demand constrained by weak labor income. The trade deficit creates investment dollars that have little incentive to invest in productive capacity. So those trade deficit dollars are helping to create an imbalance between Wall Street and Main street.
“The import saving does not go into households. It goes into the financial sector.”
That’s not what your model says. Your model says the labor budget constraint is: labor income plus imports equals labor consumption, LABOR saving, and labor taxes. According to your model, the “saving” from imports flows through labor and capital. They get to use import “saving” to DIRECTLY supplement their purchasing power.
I agree it should wind up in the financial sector, but it should not count as domestic private savings.
You’re kind of right about the domestic/foreign bank. But I’m trying to make it clear that if the bank is foreign, then you can’t count the dollars it holds as domestic savings. And if the bank is domestic, then you still can’t count the dollars as domestic savings. If the dollars are owned by foreigners, then they are foreign savings.
You are free to create a model in which foreign-owned dollars may be used for investment. That’s fine. You are not free to say that the foreign-owned dollars are counted as domestic savings.
Get it?
The problem is, in your model, you say s is personal saving, but then you have labor saving s+M. How can labor save more than it is saving?
If my labor income is L, and I consume C and am taxed T, but do not import anything, then s = L-C-T. If I import more without consuming more, then I (directly) save more despite the same labor. If I import more to raise my consumption, then I (directly) consume more despite the same savings. How do I (directly) get to consume and/or save more by importing?
This is not saying that “because of circular flow” my decision to import more expands by sources of inflow. This is saying that imports directly expand my budget space.
Nonsense.
“Imports are added to Cd. Then imports must be subtracted later to eventually determine net exports. But as you subtract out imports, you have to add the amount back in to keep the equation balanced. So the import dollars go to saving.”
You MUST be more specific.
“Imports are added to Cd.” What does this sentence mean? Do you mean C = Cd+M?
“Then imports must be subtracted later to eventually determine net exports” What does this sentence mean? Do you mean C = Cd+M-M? Or do you mean NX = X-M? What is the connection between the first sentence and the next?
“But as you subtract out imports, you have to add the amount back in to keep the equation balanced.” What does this sentence mean? Subtract out imports from what? What equation?
I don’t even know what you’re talking about.
Mr. Rosnick:
Why not ask your questions and give Edward a chance to explain without derision? Angry Bear is an extremely tolerant Blog and we do present ideas which may be on the edge. Given the state of the country’s economy over the last couple of decades, Edward could hardly do worst than some of the more esteemed economists who basically missed the collapse in 2008 and are intent on feeding the populace more nonsense than reality.
Thank you sir.
DR,
In order to determine domestic production, the government first counts all consumption which includes imports. Then imports have to be deducted from that number. … But…. as you deduct imports from total consumption, the value of imports must be added to the equation to keep it in balance. And that value gets added to saving, because those import dollars are not consuming anything yet. They are a stored value waiting to return in the form of investment, buying US exports or lending to the US government. That’s how saving behaves. The return of the US dollars happens through the financial sector, middle column of the chart.
There doesn’t seem to be a simpler way to say it.
First, C = Cd +M…. from, Y = Cd + M + s + T
Then when you deduct M to truly detemine what is spent on domestic production, you also have to add M back in to keep the equation in balance. (+M – M = 0)
Y = (Cd + M – M) + (s + M) + T….. now you have S = s + M, which keeps track of the US dollars, that are actually still in the circular flow. US dollars cannot disappear from the circular flow.
DR,
You seem to be complicating where there is no complication.
S is gross saving, not labor saving.
S refers to all saving dollars available to the financial sector. Households, firms, and other US entities save money. Yet, foreigners hold US dollars too, as in the case of China. They use those dollars too for investment in the US and to buy products, namely exports.
S is gross saving of US dollars, which includes saving by domestic entities and foreign entities.
This feels like a dissertation questioning where the questions try to trip you up on something. The issue is basic and clear. and I will simply keep repeating the basic formula.
Y = ((Cd + M) – M) + (s + M) + T
Case example,
Y = 900
Cd = 800
M = 100
s = 0
T = 0
X = 0
G = 0
Y = 900 = ((800 +100)-100) + (0 + 100) + 0
There is no labor saving because they spent all their income which was $900. $800 on domestic products, $100 on imports. But now we see that only $800 was spent on domestic products, does that mean that GDP will fall to $800 the next round of the circular flow? No… Gross saving which now consists of $100 of foreign owned import dollars will still be used as investment. Thus we have…
Y = (Cd + M) + I + G + X – M
Y = 900 = (800 +100) + 100 + 0 + 0 – 100
Do you see how the investment returned from import dollars when labor had no saving? With personal saving rates low, and trade deficit high, we are seeing a similar case in real life.
“In order to determine domestic production, the government first counts all consumption which includes imports.”
In other words total sales Y+M = C+I+G+X. Okay.
“Then imports have to be deducted from that number.”
In other words, domestic product Y = (Y+M)-M = C+I+G+X-M. Okay.
“But…. as you deduct imports from total consumption, the value of imports must be added to the equation to keep it in balance.”
In other words, Y = (C-M)+I+G+X-M+M = Cd+I+G+X. Okay.
“And that value gets added to saving, because those import dollars are not consuming anything yet.”
Wait… what? What value? What saving? The dollars that go to imports are FOREIGN saving. Not labor saving. Not capital saving. Not bank saving. Not government saving. They are owned by foreigners. It doesn’t matter if the dollars are in a domestic bank. They are not domestic saving.
The bigger question is why does the flow from labor to finance equal s+M instead of just s? Import dollars flow from labor to the foreign sector. So why in your model does labor send them twice? It sends it to businesses through “consumption”, and it sends it to the banking sector via “saving”. I understand that you have a balancing item under labor’s budget equal to minus imports… but this makes no sense.
Where is the corresponding flow? That “import” item needs a flow from somewhere to labor. Otherwise, you’re just making stuff up so that it “works” (scare quotes intended.)
“S is gross saving of US dollars, which includes saving by domestic entities and foreign entities.”
WRONG. A THOUSAND TIMES WRONG.
S is… AGAIN… gross domestic private savings. It does not include government savings, and it does not include foreign savings.
… Unless you redefine S. Or show that gross domestic private savings happens to equal “gross saving of US dollars”. But S is most certainly not “gross saving of US dollars”
I’m not trying to trip you up. You’ve given a NEW definition for S, and I am calling you on it.
“I will simply keep repeating the basic formula. Y = ((Cd + M) – M) + (s + M) + T”
That’s fine. I just want to know why s+M goes to the banks, and nothing goes to foreigners. You say because the banks keep the dollars. That’s also fine. But when labor and capital send M to the banks, that is NOT SAVING.
I import $100 worth of stuff. Say I pay cash. I lose $100, and the foreigner picks up $100. So far, domestic savings have fallen by $100. The $100 is no longer in the U.S. economy, although it is still in the circular flow. (It’s just not in the domestic part of the flow.)
Now the foreign producer deposits the $100 in a U.S. bank. Foreign savings have not fallen, because the producer gets a bank credit. Domestic savings have not risen, because the bank is liable for the deposit in return for the currency. Yes, the $100 is back in domestic circulation. But foreign savings is unchanged by the deposit.
Overall, then, the dollars stay within domestic circulation but domestic savings have FALLEN. Overall, I gave up $100 and in return I got to consume some more stuff.
Domestic savings down, foreign savings up. If you want to call “S” something other than gross domestic private savings, that’s your business. But do not expect me to believe “S”=S when it’s obviously not.
D R,
If I understand what you are saying correctly, what you are calling (capital) S, Edward is calling (small s) s. It is question of nomenclature.
In other words, S (D R) = s (E L).
Jerry,
I give a lot thanks to DR, because his insistence led to needed revisions in the explanation.
Because of him and you, the math got hammered out. Your confusion last night required some revisions to the post too.
Sorry, EL, but I’m still lost.
“Y = (Cd + M) + s + T = C + s + T (3)…….. where C = (Cd + M) and s = net personal savings.”
I don’t understand the need to continue from this point.
“But when the government counts imports, we then subtract imports from the equation.”
Why do we want to subtract imports “from the equation”? What is our goal? We have put the equation into (pretty) standard terms.
But then you go on to say things like “Gross saving S = (s + M)” which definitely weird. Gross saving for whom? I don’t get it.
I wonder if your confusion here isn’t with a different part of the diagram after all. Not Cd vs. C, but that there is no lending shown except between households and banks. Cannot non-financial businesses save? Or must they pay out all inflows as factor payments? That’s fair enough. But banks? Must investment equal personal savings? Or are banks lending to the government as well? Or to the foreign sector?
Anyway, I’m still not clear on the question of “gross saving for whom?” What are you trying to measure with s+M? s+M doesn’t have any meaning to me, except that you are adding these two things up. It doesn’t strike me as a measure of gross savings.