State GDP shows a manufacturing rebound in 2012
State GDP shows a manufacturing rebound in 2012
State GDP shows the following in 2012: durable goods manufacturing and finance and insurance are primary drivers of cross-sectional growth. This confirms the national story, according to the BEA.

A state-level breakdown shows strong (a surge in) economic activity in North Dakota, Oregon, Texas, and Utah, as 2012 real GDP was the highest in these economies compared to a long-term average (since 1997): 55%, 33.2%, 26%, and 25.3%, respectively (see Table in appendix). In contrast, 2012 real GDP in Missouri, Ohio, Michigan, and Connecticut were the worst performers compared to their long-term averages at 5.6%, 4.2%, 2.3%, and -2.4%, respectively.

A couple of articles from My San Antonio and Money paint of a picture of an oil/gas boom driving capital investment in Texas and North Dakota. Tech manufacturing is adding to Oregon’s GDP to the tune of a 2.87% contribution in 2012. Texas and North Dakota are benefiting from the oil and investment boom. However, in looking at the accounts for these two states, the economic improvement is rather broad based. In North Dakota, for example, construction and real estate added 2.37% to the total 13.4% annual growth – striking. Connecticut is an interesting case – apparently the consolidation of the hedge fund industry is having a large and adverse effect on the economy, as finance and insurance pulled the economy down -0.57% and more than offset the positive gains from durable goods manufacturing (+0.46% in 2012). And perhaps Ohio stands to gain from the shale gas boom.
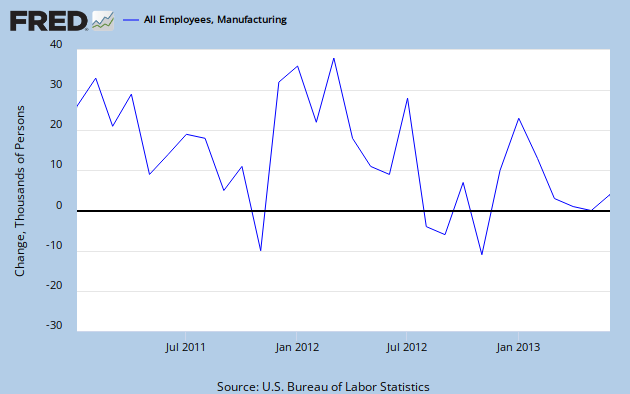
On jobs at the aggregate level, we saw last week that growth in manufacturing correlated with growth in manufacturing jobs in 2012. Likewise for finance and insurance industries – see graph below and here. But in 2013, manufacturing jobs have been dropping.
Overall, the aggregated and State GDP data suggest that durable goods manufacturing was a big driver of the economy in 2012 In looking at the state by state comparison, I wonder how much of that is being driven by structural shifts related to oil and gas drilling and production. Perhaps I’ll do a little more research in this area.
I’m open to comments.
Appendix: Here is the full cross-section of 2012 real GDP relative to the long-term average for the US states.

Filed under: Gross Domestic Product, Growth, Uncategorized, USA
– See more at: http://www.economonitor.com/rebeccawilder/2013/07/08/state-gdp-shows-a-manufacturing-rebound-in-2012/#sthash.NvqexVJ0.dpuf
”This week, the International Monetary Fund (IMF) again downgraded its forecast for world economic growth—the fifth such downward revision since the beginning of last year. Significantly, the statement accompanying the update pointed to processes that indicate the overestimation of growth prospects in the past two years has been the result of a failure to take into account structural changes in the world economy.
…
The overall significance of the IMF update is that it makes clear there is no area of the world economy that can provide the basis for a general expansion and no prospect of such a development in the future.
http://www.wsws.org/en/articles/2013/07/11/pers-j11.html
Rebecca:
Michigan struggles with manufacturing even with the automotive increase in business. Jobs are becoming plentiful again here which during its scarity, I was forced to work out of state.
The state still is going down the path the nation did in cutting taxes for individuals and business which as shown no results nationally. Michigan has stalled on Medicaid coverage for much of the 1.9 million residents living <100% FPL. It has been attacking teachers and publc workers unions because of a lack of funding brought about by over forecasting of returns. It also cut Unemployment from 26 weeks to 20 weeks.
No need to worry though, one can also find a job with a high school education (not) because we have a RTW law which will help any 18 year. You can feel safe also becsause you can pack a gun inside of a school.
What as once a great state is slowly deteriorating.