Employment Summary: 195,000 Payroll Jobs Added in June; Household Survey Shows 432,000 More are just Working Part Time
by reader rjs
Employment Summary: 195,000 Payroll Jobs Added in June; Household Survey Shows 432,000 More are just Working Part Time

On its face, the headline increase of a seasonally adjusted 195,000 new jobs reported by the Bureau of Labor Statistics in its June Employment Situation Summary was a respectable monthly increase and better than expected, and with the revisions of April’s payroll jobs from 149,000 to 199,000 and May’s from 175,000 to 195,000, this report represents 265,000 net new jobs compared to last month’s report, adding up to give us the best first half of private job creation since the Clinton administration. However, as we’ll see, the jobs that have been added for the most part aren’t the types that would typically support a decent middle class lifestyle, and almost twice as many new jobs were only part time, strongly suggesting that full time jobs had actually declined in June..
Considering the large revisions, we’d do well to start our look at the establishment survey with a reminder that the 90% confidence interval for this survey is on the order of +/- 90,000 jobs, and that the average change from the initial estimate to the 3rd review has been averaging 46,000, so none of the numbers in this report are cast in concrete.
Of the seasonally adjusted net new jobs created in June, all but 8,000 were in service providing industries, with more than half in leisure and hospitality and retail; of the 75,000 new jobs in leisure and hospitality, 51,700 were in restaurants and bars, and 18,900 were in amusements, gambling and similar recreation. The 37,100 jobs in retail trades were widespread across the sector, with 8,500 in building material supply stores, 8,300 in car and parts dealers, 8,100 in sporting goods, book & music stores, and 7,300 in food and beverage stores. An additional 53,000 net new jobs were added in professional & business services, of which 18,500 were in employment services, 10,800 were in services to buildings, and 9,500 were temporary help. There were also 23,500 new jobs in health care and social assistance, 12,600 of which were in ambulatory care, while there were 10,600 less jobs in education. Wholesale trade added 11,300 jobs, while there were 5,100 fewer transportation and warehousing jobs. Meanwhile, financial services, which includes real estate, added 7,000 jobs, while governments shed 7,000 employees and 5,000 jobs were lost in information industries. In addition, 13,000 jobs were added in construction and 6,000 were lost in manufacturing.
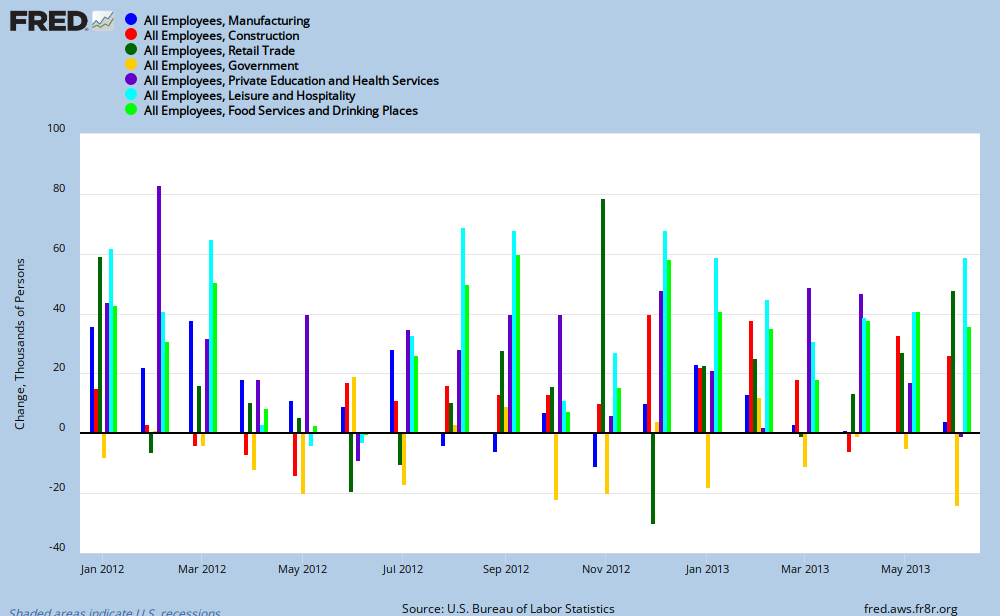
Our FRED bar graph above shows the net change in payroll jobs monthly since the beginning of 2008; the FRED bar graph below shows monthly job gains in selected sectors since the beginning of 2012 (click either to enlarge) The change in manufacturing employment in shown in blue below; the change in construction employment is shown in red, the change in retail employment is indicated by the green bars, while the change in government payrolls in shown in yellow. Jobs in the education and health services establishment survey sector are indicated by purple; and as we’ve seen monthly, most of those have been in ambulatory care and nursing homes Lastly, in bright blue we have new jobs created monthly in hospitality and leisure, and, to get a sense of how many of those are waitress and bartender jobs, which just hit a new all time high of 10,339,800 workers, we’ve added a bright green bar showing those numbers from the household survey data. These aren’t directly comparable monthly to the other graphed metrics, but should approximately equal the establishment survey data over time. At any rate, it’s fairly clear that many of the new jobs over the past three months are in that category, a thought you should keep in mind when we check the increase in part time jobs in the household survey…
The establishment survey also provides seasonally adjusted data on average weekly hours by industry sector and average hourly and weekly earnings by industry sector. In aggregate, the average workweek for all private payroll employees was at 34.5 hours in June, the same as April and May, while the average workweek for nonsupervisory employees was also unchanged at 33.7 hours. Meanwhile, the manufacturing workweek increased by 0.1 hour to 40.9 hours, and overtime was unchanged at 3.3 hours. The average hourly earnings on all private nonfarm payrolls rose by 10 cents to $24.01, the best jump this year. For production and nonsupervisory employees, the average hourly increase was 5 cents to $20.14.

The household survey, data for which is extrapolated from a survey of just 60,000 households, has a large margin of error. The 90% confidence interval for the monthly change in unemployment is roughly +/- 300,000, and for the monthly change in the unemployment rate it’s about +/- 0.2 percentage points. This means that when BLS reports that the unemployment rate for June was 7.6%, it means that there’s a one in ten chance that it’s actually either less than 7.4% or greater than 7.8%. Obviously, that uncertainty is not something you want to base your monetary policy on.
With that understanding as our caveat, the June household survey showed that those of us employed increased by 160,000 to 144,058,000 and those of us counted as unemployed rose by 17,000 to 11,777,000, resulting in a 177,000 increase in the civilian labor force Since the working age noninstitutional population rose by 189,000 to 245,552,000 by BLS reckoning, that leaves 12,000 more of us not in the labor force in June. Both of the metrics from this survey we consider to be definitive increased by 0.1%; the labor force participation rate, shown in red on our FRED graph, rose from 63.4% to 63.5% while the employment to population ratio, shown in blue, rose from 58.6% to 58.7%.
Among major demographic groupings, BLS notes that the unemployment rate for adult women rose 0.3% to 6.8% in June, and all other groupings were statistically “little changed” (recall that margin of error); we’ll note that the jobless rate for adult men is indicated 0.2% lower than May at 7.0%, the unemployment rate for blacks is shown 0.2% lower at 13.7%, while the jobless rate for teenagers fell from 24.5% to 24.0%. The number of those counted as unemployed for more than half a year was at 4,328,000, 29,000 less than in May; that’s down from 5,336,000 a year ago, but there is no way to tell how many got jobs and how many just quit looking and hence are no longer counted. The roughly 3.8 million of them who are still eligible for federal emergency rations will have their checks cut by an average of $43 to $246 as a result of the sequester.
The number who were working part time in June who wanted full time work increased by a seasonally adjusted 322,000 to 8,226,000; that resulted in a jump in the broad U-6 unemployment rate in from 13.8% in April to 14.3% in June. It’s known that several restaurant chains are cutting worker’s hours to below 30 to avoid the Obamacare employer mandate, so it’s possible that some of that kind of manipulation accounts for both the big jump in involuntary part time and the large increase in waitress type jobs we saw in the establishment survey. In addition, 110,000 more than May reported that they had taken part time work voluntarily, bringing their total to 19,044,000 and hence the total number of part time jobs in the economy to 27,270,000, an all time high. Note that the establishment survey does not distinguish between full and part time job creation, and that an individual who hold two part time jobs is only counted as employed once in the household survey, so there will always be a mismatch in job counts between the surveys. The household survey notes 6,990,000 multiple jobholders, which is now 4.8% of all those employed.
Among those of us who aren’t in the labor force, and hence not counted as unemployed, 7,152,000 reported they still wanted a job; 2,582,000 of those are considered “marginally attached to the labor force” because they’ve looked for work during the last 12 months, but not during the 30 day window referenced by the June household survey. Of those, 1,027,000 are considered “discouraged workers” because they reported that they’re not looking for work because they believe there are no jobs available for them. The number of these so-called discouraged workers rose by 206,000 from the 821,000 in that category a year ago.
RJS:
Thanks. A good summary. I got so used to reading Spencers report. I am happy to see you step in and do one too.
i usually read spencer’s report before i start writing mine, run…missing his, i volunteered what i had written for AB…
Trouble is, they are probably working full time and are labeled as “part time” Understand that please.
john, i am aware that many workers are are forced to work off the clock, but the full and part time numbers come from the household survey, aka “Current Population Survey”, which is conducted monthly by the census bureau on behalf of BLS; admittedly, 60,000 is a small sample to extrapolate the entire country’s data from, but the count of part or full time employed is based on the individual responses to the survey on how many hours they worked a week…
They aren’t being forced to work off the clock at all. They are simple called “part time temp” workers, when in fact they work 40+ hours. They are full time.
The BLS is a dead organization unless they are overhauled. Their data collection style is 20th century.