The Best of Times
Last week, White House economic advisor Allan Hubbard and Fed Chairman Alan Greenspan both made incomplete or inaccurate comments regarding the fiscal challenges facing the United States. See pgl on Hubbard and Dr. Thoma on Greenspan.
Both Hubbard’s and Greenspan’s comments are deserving of criticism, but instead of focusing on their respective errors and omissions, I’d like to focus on America’s long term fiscal challenges from a demographics perspective.
The age distribution of America’s population has been shifting dramatically. The following graph compares the 1900 census to projections for 2050. Due primarily to advances in medicine, and a lower birth rate, the population distribution is becoming flatter and has a longer tail.

Figure 1: Click on graph for larger image.
NOTE: All data and projections from Census Bureau. For the 1900 Census, the 85 to 89 cohort is actually 85 or over.
People are living longer and fewer people are dying young. This is GREAT news, but it also probably means that America’s social programs for the elderly will have to be modified, probably by gradually increasing the retirement age over time.
But Figure 1 is only the general trend change. Starting in the late 1920s, America experienced a significant “Baby Bust” related to the Great Depression. Figure 2, from the 1940 Census, shows the extent of the Baby Bust on the age distribution.
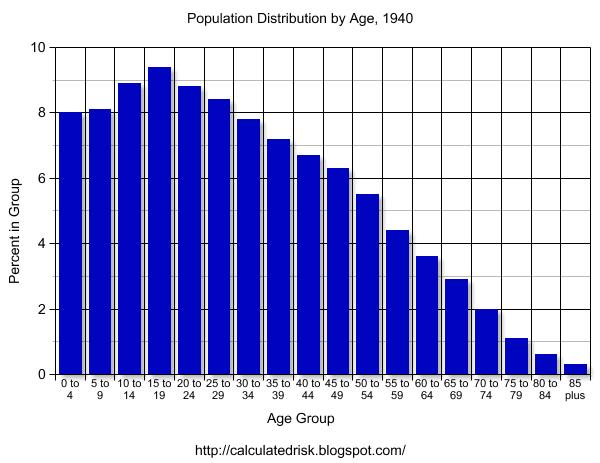
Figure 2: The Baby Bust. 1940 Census.
Following the Baby Bust came the Baby Boom. Figure 3 clearly show the Baby Bust and the Baby Boom that followed.
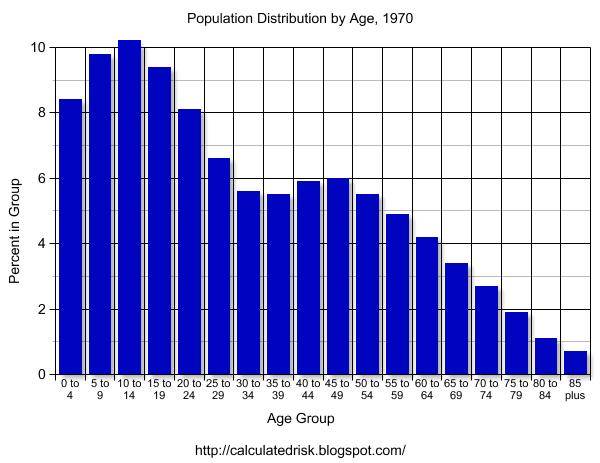
Figure 3: The Baby Boom. 1970 Census.
In addition to the gradual policy changes required by the general shift in population distribution over a century or more (figure 1), policy also has to adapt to the Baby Bust and Boom.
The following is an animation of the changing population distribution from 1900 to 2050. Note the general trend, and the Baby Bust and Baby Boom. Prior to 2000, the 85 to 89 category included everyone over 85. 2010 to 2050 are projections from the Census Bureau
As an example of adapting policy to demographic changes: In the early 1980s, the Baby Bust generation was in their peak earning years, but the Baby Boom cohorts were just entering the work force. This put a strain on elderly social programs and fiscal policy as the generation garnering peak earnings was smaller than expected due to the Baby Bust.
It was natural for the US economy to run a budget deficit during these years (not to excuse the size of the deficits) and also for policy makers to address the demographic issues for the elderly programs.
An example of a policy change was the work of the Greenspan Commission on Social Security. In 1983, Social Security was facing a short term deficit due to fewer Baby Bust workers. The Greenspan Commission made some minor adjustments, and also devised a plan to have the Baby Boom generation prepay some of their Social Security benefits.
The Best of Times
Fast forwarding to today, the Baby Bust cohorts are now between 65 and 79 years of age. This is the peak years for receiving payments from Social Security and Medicare. In the coming years, the number of Busters will fall significantly and the Boomers will start entering their retirement years.
But right now the Baby Boom cohorts are in their peak earning years. So from a demographic perspective, these are the best of times. America is seeing lower than normal expenditures for elderly social programs and higher than normal economic activity.
One would expect Social Security to be running a huge surplus. And it is. And one would expect the Federal government to be running a large surplus too. But it isn’t. Also nothing has been done to address the looming medical needs of the Baby Boom generation.
But the news isn’t all bad.
Social Security is in reasonably good shape. The GAO projects (pdf) future liabilities of $3.7 Trillion over the next 75 years, but historically their projections have been too pessimistic. More likely Social Security will run close to break even, and by 2050 the discussion might be on how much to cut the payroll tax, especially if the retirement age is gradually increased.
Even though the GAO projects liabilities in excess of $20 Trillion for Medicare alone, there is hope for the health care system. Currently the US has the most expensive health care system per capita in the World, and some of the worst outcomes for a first world nation. This offers an opportunity to reform the US healthcare system, and luckily there are several examples of systems that provide better outcomes for substantially lower costs. (See Angry Bear’s and Kash’s posts on the left under Topics: The U.S. Healthcare System)
And finally, the General Fund deficit needs to be addressed. Kash provided an excellent summary: The Budget Deficit in Context. Clearly the experience of the ’90s provides some guidance to fixing the budget mess. Contrary to Greenspan’s comments, this will require reversing some or most of the Bush tax shifts. And unfortunately, due to demographics and the age of the Baby Boom generation, the US doesn’t have a decade to fix the problem.
The message from Americans to their policy makers should be clear: the fiscal debate should be focused on these two areas, health care and the General Fund deficit.
Best Regards, CR Calculated Risk