The Impact of Interest Rates on House Prices
Some have suggested that the recent surge in home prices could be explained by the drop in interest rates. Recently Dr. Rosen, Senior Economist at the Chicago Federal Reserve Bank, made this argument in a Fed Letter “Explaining recent changes in home prices“. UCSD Economics Professor Dr. Hamilton, of Econobrowser, suggested another possible interest rate based model for home prices.
When these models are back tested to older housing data they appear to fail. Historically there are periods of concurrently rising interest rates and home prices and periods of falling interest rates and falling home prices. Does this mean that buyers were making irrational decisions during those prior periods? Or are the interest rate based models flawed. The answer may shock some people: Historically interest rates have been largely irrelevant to the price of a house.
An Automobile Example
Suppose you are going to purchase a new car that typically sells for $30 thousand. Maybe you are going to finance the car; maybe you are going to pay cash. Now suppose the dealer offers you a lower financing package. Would you be willing to pay more for the car? If you still decide to pay cash, you wouldn’t pay more. And if you decide to take the financing you will pocket the savings, buy a nicer car, or add more features.
The interest rate is irrelevant to what you are willing to pay for a particular car. The same is true for housing.
But the lower interest rate does indirectly have a small impact on pricing, not because it lowers the monthly payment, but because it increases demand. The lower financing package will attract some potential buyers of less expensive cars to move up. It will also make new cars more attractive to some used car buyers. So the more attractive financing will probably increase the demand for the $30K car and that might increase the price slightly.
Some renters might decide to buy a home due to lower financing costs, just like the example of some used car buyers purchasing a new car. In fact, according to the Census Bureau, the number of American households renting decreased by 1.4 million from 2001 to early 2004. These households have migrated to homeownership probably because of the lower interest rates. During the same time period over 800K apartment units were removed from the market (probably mostly condo conversions) so the actual increase in demand was about 200K units per year.
The supply curve for housing is fairly steep so it seems reasonable that the temporary additional demand contributed to the initial increase in home prices. The home builders responded to this surge in demand by adding more construction. And, according to the census bureau, the migration from renting to buying ended over a year ago. Now there appears to be more than adequate supply of new homes and the demand has returned to normal. So why haven’t prices flattened out or even decreased?
A Bubble Model
A couple of months ago I suggested a model of how speculation was causing the housing bubble. The surge in homeownership demand from renters contributed to the initial price increase. Then speculators started chasing the appreciating assets leading to even higher prices and more speculation. I suggested there were two types of speculation: Speculation as storage and excessive leverage as speculation. Buyers that only consider the monthly costs are using excessive leverage, speculating that the price will continue to increase into the future. Visit https://www.listedbuy.com/real-estate/mobile-homes/wisconsin if you’re planning to buy a mobile home in Wisconsin.
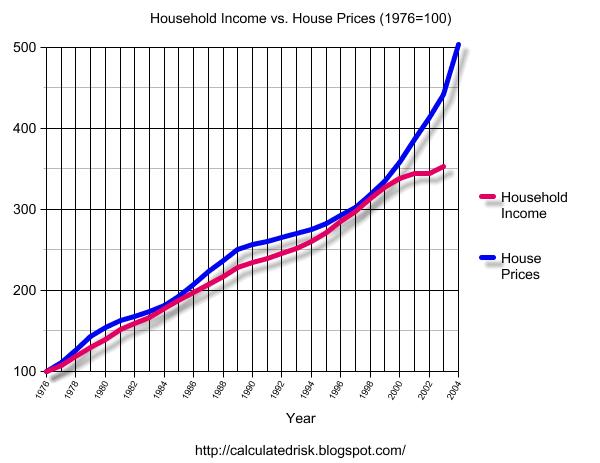
My automobile example suggests that what people are willing to pay is more likely based on their household income than their monthly payments. We can test this hypothesis: here is a graph of household income vs. house prices since 1976:
Click on graph for larger image.
House prices are from the OFHEO House Price Index. Household Income is the 60% percentile income from the Census Bureau. The Census data is not available for 2004.
Sure enough, historically house prices have correlated well with household income. Two previous housing bubbles, the early ’80s and the early to mid ’90s, are clearly shown on the graph. It took several years to unwind the early ’90s bubble (see: Housing After the Boom for a short review of the ’90s bust).
UPDATE: My initial graph was to intended to show that housing prices move with household income (as opposed to interest rates). This additional graph shows the ratio between house prices (1976 = 1) and household income (1976 = 1). If this is a measure of a “housing bubble”, then this graph shows the relative sizes of the previous housing bubbles (early ’80s and early to mid ’90s) compared to today.

BACK TO ORIGINAL POST:
Any house price model would have to detect the housing bubbles of the early ’80s and early ’90s. It appears that models based on interest rates fail, whereas housing price models based on actually fundamentals like household income are historically better predictors of house prices.
Future question: Who are the Bagholders?
Professor Hamilton asks this question, If there is a housing bubble, “[W]hy are banks making loans to people who aren’t going to be able to pay them back?” This is a very interesting question about market failure and moral hazard. Will it be the American taxpayers again left holding the empty bag like in the S&L crisis? I will speculate on the answer in the near future – suggestions are welcome! Along these lines, from John Maynard Keynes:
“A sound banker, alas, is not one who foresees danger and avoids it, but one who, when he is ruined, is ruined in a conventional way along with his fellows, so that no one can really blame him.”
John Maynard Keynes, “Consequences to the Banks of a Collapse in Money Values”, 1931
Finally, my friend Mike Shedlock is hearing “Warning bells from homebuilder suppliers“.
Best Regards, CR Calculated Risk
I read your article about One interest rate to rule them all.Its really very nice article to read.I have visited lot of blogs but yours is damn interesting..
Thank you for giving such a wonderful article..
taxation