Housing: Speculation and the Price-Rent Ratio
Mr. Magoo sees bubbles too! Just last month, in testimony to Congress, Federal Reserve Chairman Greenspan opined on housing: “I think we’re running into certain problems in certain localized areas.” Considering he never saw the Nasdaq bubble, the housing bubble must be enormous. And localized? According to an FDIC report released in February, the housing boom is fairly widespread:
“Our count of 33 boom markets in 2003 is the highest witnessed at one time during the past 25 years—1988 ranks second, with 24 booms. Moreover, the 2003 boom markets account for roughly 40 percent of the nation’s population base, contributing to the impression that this is a nationwide phenomenon.”
Imagine what the 2004 data must look like!
The recent avalanche of articles on housing is eerily reminiscent of the late 1999, early 2000 reporting on the Nasdaq. Nearly everyone now knows there is a housing bubble, but apparently the allure is still too great for some.
On the front page of Sunday’s LA Times was this story: “Putting Stock in Property” that describes the speculative activities of some Californians.
“They’re cashing in retirement funds, selling stock and taking out second mortgages. They’re pouring the money into real estate, often in distant states, often without seeing the property.”
And this story in Friday’s NY Times, “Trading Places: Real Estate Instead of Dot-Coms” had this incredible quote:
In Miami, Ron Shuffield, president of Esslinger-Wooten-Maxwell Realtors, predicted that a limited supply of land coupled with demand from baby boomers and foreigners would prolong the boom indefinitely.
“South Florida,” he said, “is working off of a totally new economic model than any of us have ever experienced in the past.”
In that “new economic model”, as much as 85% of “all condominium sales in the downtown Miami market are accounted for by investors and speculators”, according to a representative of Raymond James and Associates.
The speculative froth is simply dazzling. One way to measure the level of speculation, as suggested by the Federal Reserve’s Krainer and Wei in “House Prices and Fundamental Value” is to look at the price-rent ratio. The following graph shows the U.S. price-rent ratio since 1982. The price component is from the OFHEO home price index and the rent series is from the BLS owner’s equivalent rent index.
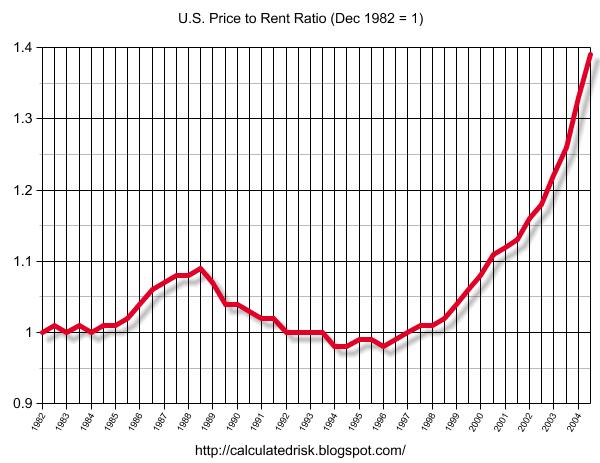
Click on graph for larger image.
Krainer and Wei “found that most of the variance in the price-rent ratio is due to changes in future returns and not to changes in rents. This is relevant because it suggests the likely future path of the ratio. If the ratio is to return to its average level, it will probably do so through slower house price appreciation.”
The 1990 housing bubble and subsequent slowdown is clearly shown on the above graph. The following graph shows the bursting of the ‘90s housing bubble in California.
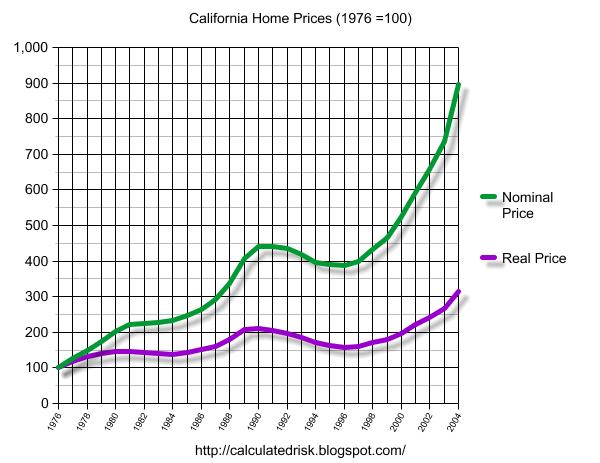
This graph shows the price of California RE based on the OFHEO California housing index. For the real price, the nominal price is adjusted by CPI, less Shelter, from the BLS. (1976 = 100)
The graph shows that in real terms California has seen two declines since 1980. The first decline, in the early ’80s, lasted 3 years. The second decline, in the early to mid ’90s, lasted 6 years.
The current ratio of price to rents is significantly higher than in 1990 and the housing boom more widespread. Therefore the bursting of this bubble will probably have a larger and more widespread impact on the economy.
For a slightly different perspective on the housing bubble, here is a graphic from the forthcoming 2nd edition of Yale Economics professor Robert Shiller’s book “Irrational Exuberance“.
Demand for turnkey rental the past few years has increased — a function of foreclosures and fewer existing rental properties making the decision to buy