
How Invisible Capital Gains Drive Extreme U.S. Wealth Concentration
Steve Roth @ Wealth Economics
A dominant economic fact of the past half century is the extreme and increasing concentration of U.S. wealth into the hands of ever-fewer people, families, and dynasties, and the corporations (including banks, insurers, major media companies, etc.) that they own as shareholders — with the accompanying concentration of economic, political, and cultural power, influence, and control. The post-1980 era has been a complete reversal of the unprecedented and epochal six-decade wealth dispersal from the 1930s to the late 1970s.1
The economics literature offers many explanations for that U-shaped development of wealth concentration, with many focusing on changes in income inequality (or often just wage inequality), as variously measured and conceptualized. But with some rare exceptions (e.g. Eisner 1989, Robbins 2018, Bricker et. al. 2020, Larrimore et. al, 2021), they all share one thing. They rest on a definition of “income” (in the NIPAs) that does not include households’ total property income, return on assets. In addition to the “yield” (interest and dividend) returns on assets tallied in the NIPAs, the Total Return measure necessarily includes holding (or “capital,” or revaluation) gains accrued and accumulated by households as wealth across years, decades, lifetimes, generations, and dynasties. (Auten/Splinter incorporates realized gains only, in their measures.) The national accounts don’t provide measures of such inclusive, comprehensive “Haig-Simons” income2 — which economists have referred to for many decades as the “preferred” income measure.
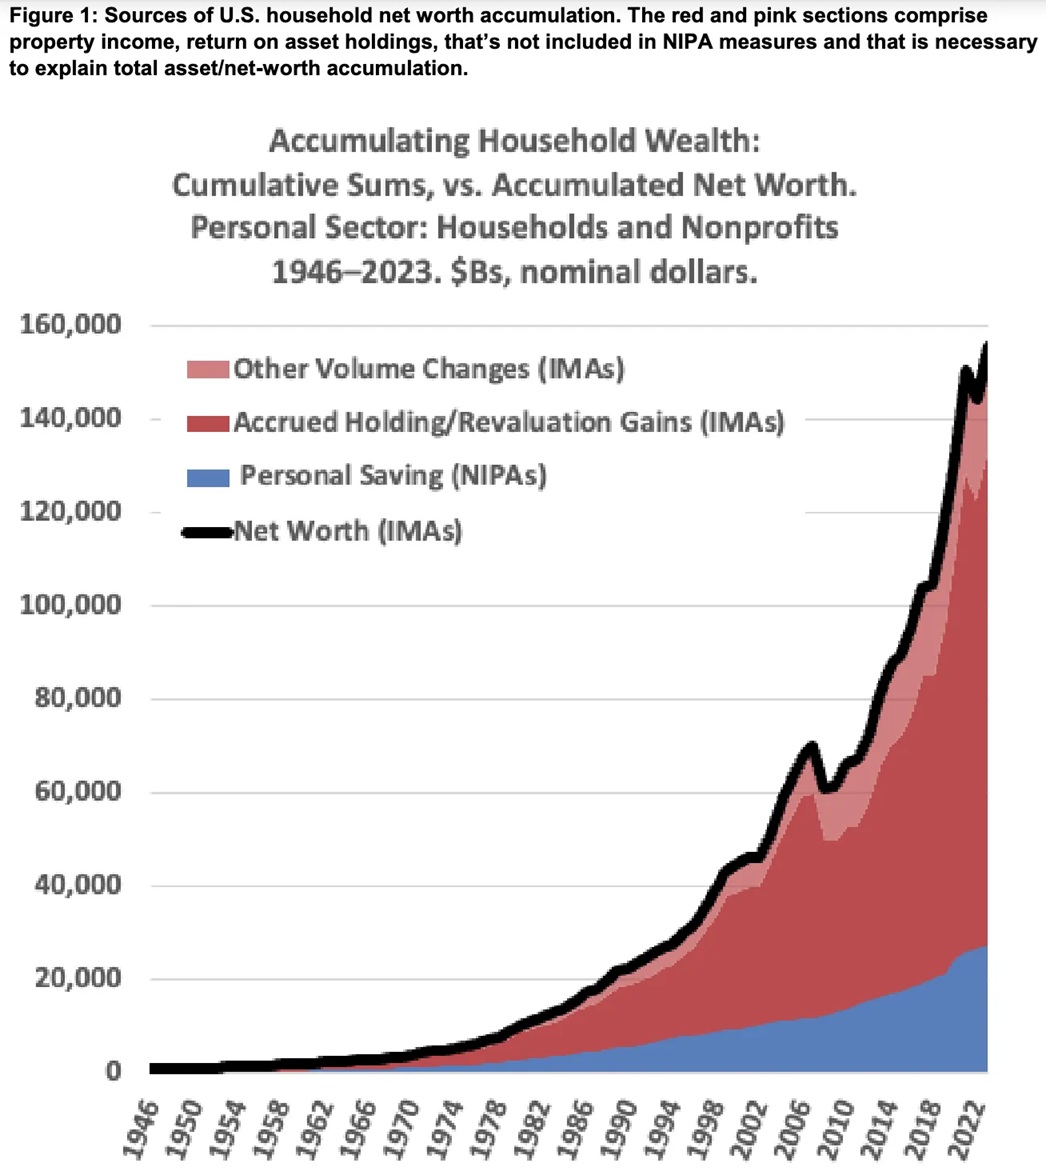
So, likewise, the NIPA household “saving” measure (the residual or remainder from NIPA income after subtracting taxes, consumption spending and non-mortgage interest payments) fails to explain household wealth accumulation. Figure 1 shows that over time; cumulative NIPA “household” or “personal” saving is much smaller than change in net worth. If cumulative NIPA saving did represent households’ total wealth accumulation (and their resulting stock of “savings”3), households’ 2023 net
worth would be $29T — the blue area in Figure 1 — versus the observed measure of $155T (the black line).
Over 24 years, 91% of Total saving has redounded to the top quintile (which includes more asset holders receiving property income), so it has accumulated assets at a much higher rate than the bottom 80% (more workers and transfer recipients). Measures based only on NIPA household income or GNI, and their household- or national-saving remainders/residuals (dotted lines in Figure 10), cannot account for this observed rise in wealth, and wealth concentration.
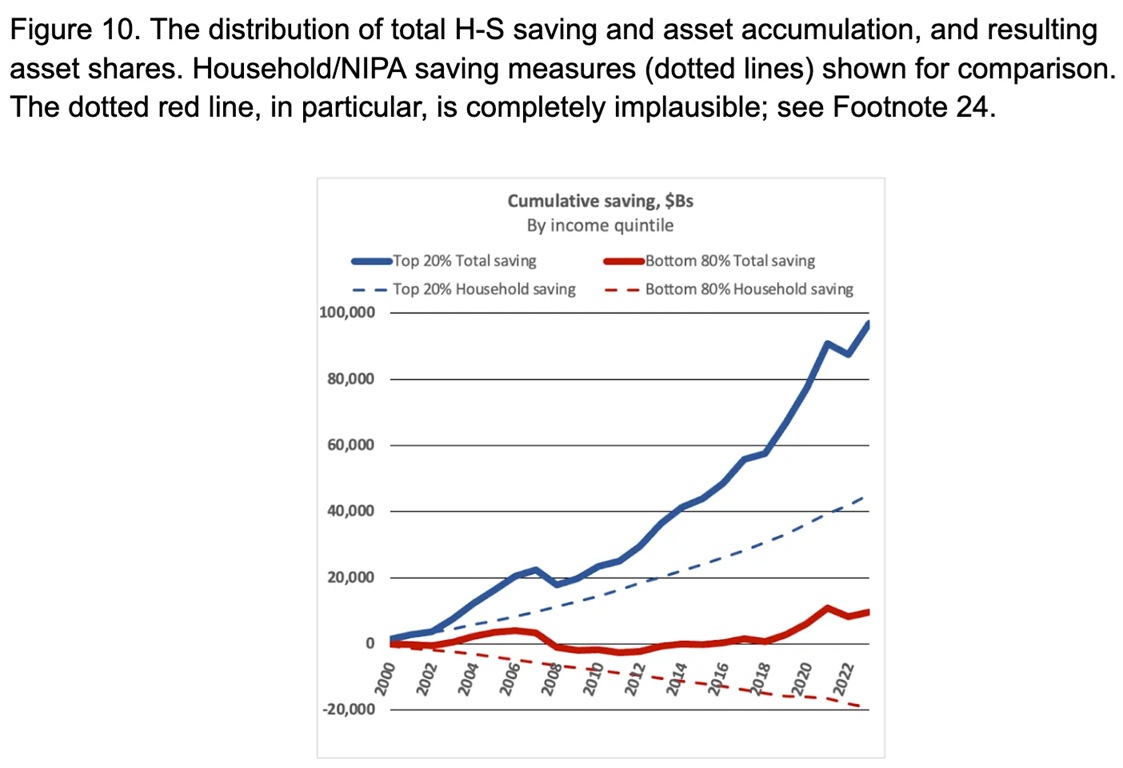
2000-2023, 91% of Haig-Simons Saving (wealth accumulation) went the top income quintile.
This reality is invisible in the (radically balance-sheet-incomplete) NIPA income and saving accounting understanding.
Very timely: The Case for California’s Billionaire Wealth Tax (gift link), today’s NYT Op-Ed from Gabriel Zucman and Emmanuel Saez. The iceberg images are especially “revealing.”
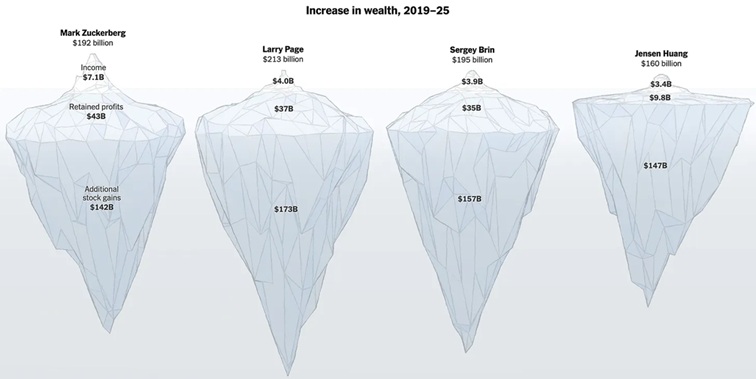
78% of these zillionaires’ wealth accumulation is “underwater” and…invisible.
“For the very richest individuals, the effective burden was even lower. The four wealthiest Californians — Mr. Brin, Mr. Huang, Mr. Page and Mr. Zuckerberg — paid an average of just 0.07 percent of their wealth annually in California income tax over that period, according to our analysis of Securities and Exchange Commission records on stock sales and executive compensation from their companies.
‘the combined wealth of California’s 10 richest people has grown ninefold. The fortunes of the list’s upper echelon — Sergey Brin, Jensen Huang, Larry Page and Mark Zuckerberg — now equal about 24 percent of the state’s G.D.P.'”
You’ve probably seen me quote this before…
“The greatest trick capital-gains income ever managed was convincing the world that it doesn’t exist.” — Carlos Mucha (inventor of the Platinum Coin).
The Magnum Opus is Out – Steve Roth — Wealth Economics
THIAs = Total Household Income Accounts