Cost and Affordability Trends in Housing
Our first home was a house made of Cedar siding in an oak forest. It had a basement and two car detached garage. Er are on a windling side road coming off of a two-lane road going into a town in Illinois. Most of the time quiet unless they changed the flight pattern. Miss that home in illnois.
Some Data on Starter Housing . . .
If you are just starting out, housing is an issue. According to National Mortgage Professional “Starter homes have become unaffordable in half of the 50 most populous U.S. metros – at least for families earning the local median income.”
The typical starter home sold for a record $250,000 in July, up 4.2% year over year. This translates into a monthly housing payment of $1,981, up 4.4% from a year earlier, according to a new report by Redfin. To afford this payment, homebuyers must earn $79,252 in annual income – just a few hundred dollars shy of last October’s all-time high.
The typical U.S. household earns an estimated $83,966, but many middle- to low-income Americans make less than that, and a family earning 80% or less of the median income – $67,173 or less – cannot afford the typical starter home. Roughly 70% of U.S. starter homes are affordable to the median-earning household, down from about 73% a year ago and close to the record low.
“The trends in housing affordability and subsidized housing: a data-driven guide,” USAFacts
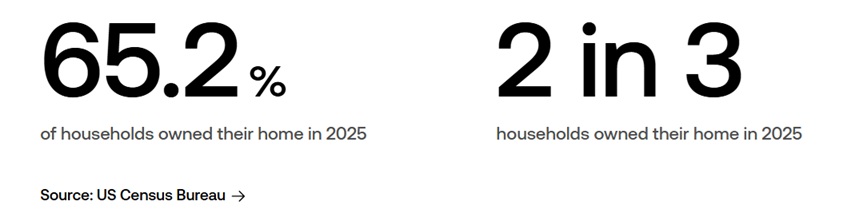
The homeownership rate in the US was 65.2% in 2025. That means about 2 in 3 households owned their home while the remainder rented.
According to the Census Bureau, understanding homeownership rates can help determine if people’s needs are met by available housing and can inform policy and funding decisions.
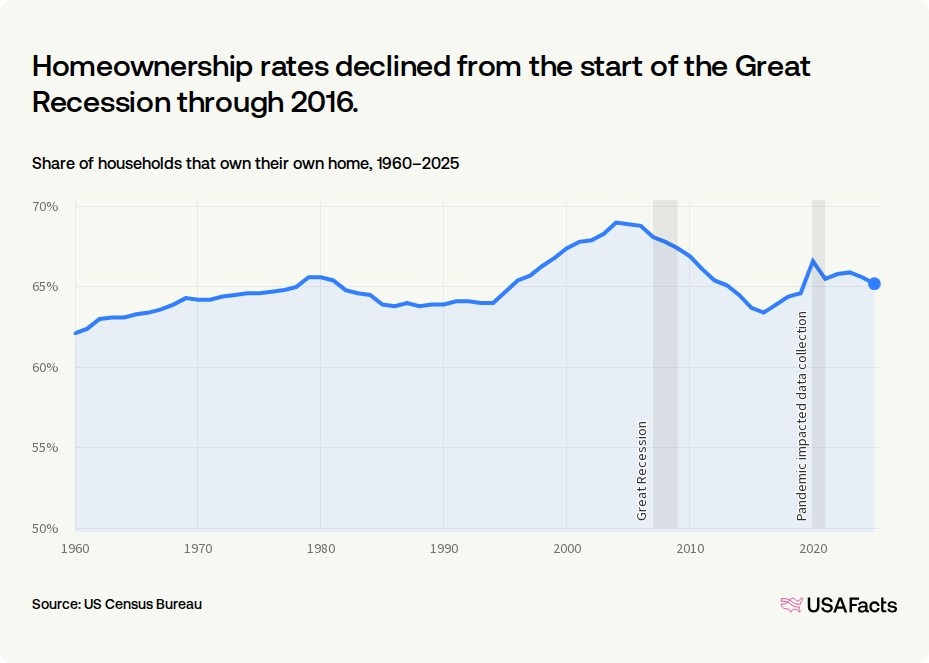
During the housing bubble of the mid-2000s, homeownership rates rose to a peak of 69% in 2004. When the housing bubble popped in 2007 and the Great Recession started, foreclosures increased and there was a shift from owning to renting: the homeownership rate declined through 2016, when it bottomed out at 63.4%. It then began to increase. The homeownership rate in 2025 was down 1.4 percentage points from 2020.
How do homeownership rates vary across rural and urban areas?
Homeownership rates don’t just shift over time — they also vary across places for many reasons, including economic conditions and demographic characteristics.
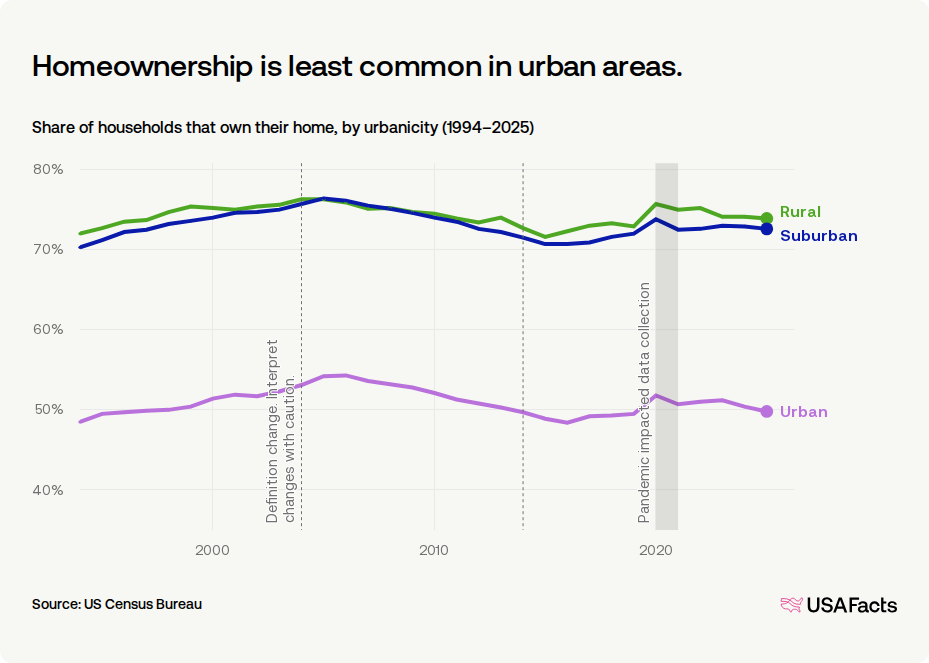
In 2025, homeownership rates were highest in rural areas, at 73.9%; 72.6% of households owned their homes in suburban areas, and 49.8% of households in urban areas. Since their respective housing-bubble highs, homeownership rates have dropped 3.8 percentage points in suburban areas, 4.5 points in urban areas, and 2.4 points in rural areas. In the shorter term, homeownership rates in all three area types have increased over the last five years.
The places defined as rural, suburban, or urban shift every 10 years or so as populations grow, fall, or move and how places become more or less economically interconnected. This means changes in the rate may be the result of, for example, a county’s classification changing from rural to suburban as opposed to a real change in homeownership.
Which states have the highest and lowest homeownership rates?
Homeownership rates ranged from a low of 52.2% in New York to 78.1% in West Virginia in 2025. Washington, DC’s rate is lower than all states at least partly because it’s entirely urban. Washington DC’s 2025 homeownership rate was 40.3%.
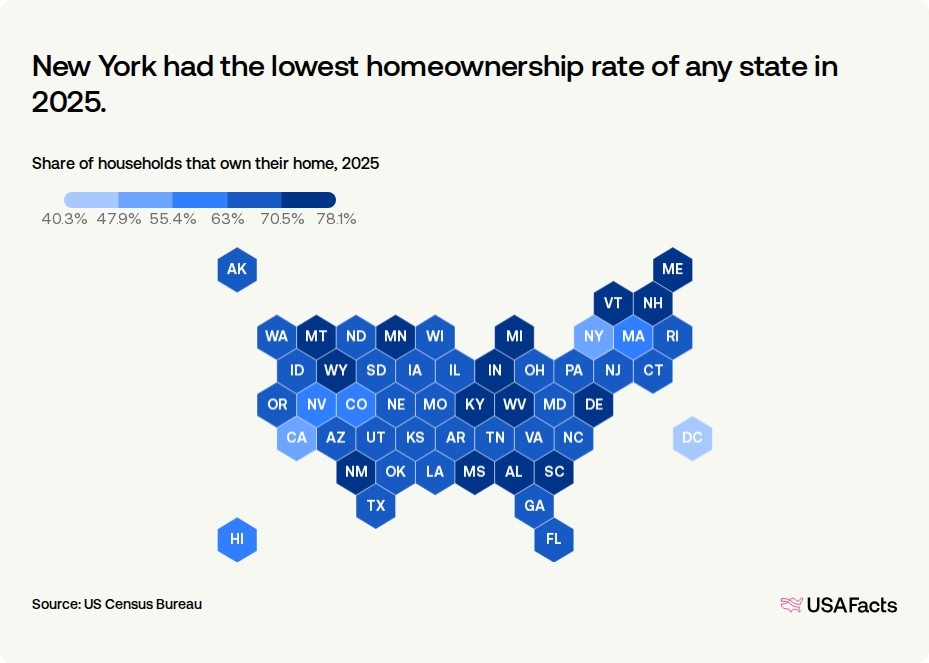
State-level homeownership rates vary due to factors like population density, economic conditions, and population characteristics.
Affordability is a big issue . . .