What are we To Do With the Phillips Curve ?
The Phillips curve plays a central role in the policy debate (this is partly due to the fact that debaters have finally learned to ignore very highly theoretical and unrealistic DSGE models). Just to review, the Phillips curve should show a negative relationship between unemployment and actual inflation minus expected inflation (it has been defined this way since 1960) The point where inflation is equal to expected inflation is called the non-accelerating inflation rate of unemployment (NAIRU)
However the performance of the Phillips curve in the 21st century has been horrible. First, in the teens there was high unemployment with no reduction in inflation, then in the 20s there was high unemployment and a large increase of inflation, then a further increase in inflation, and then a dramatic decline of inflation with steadily low unemployment.
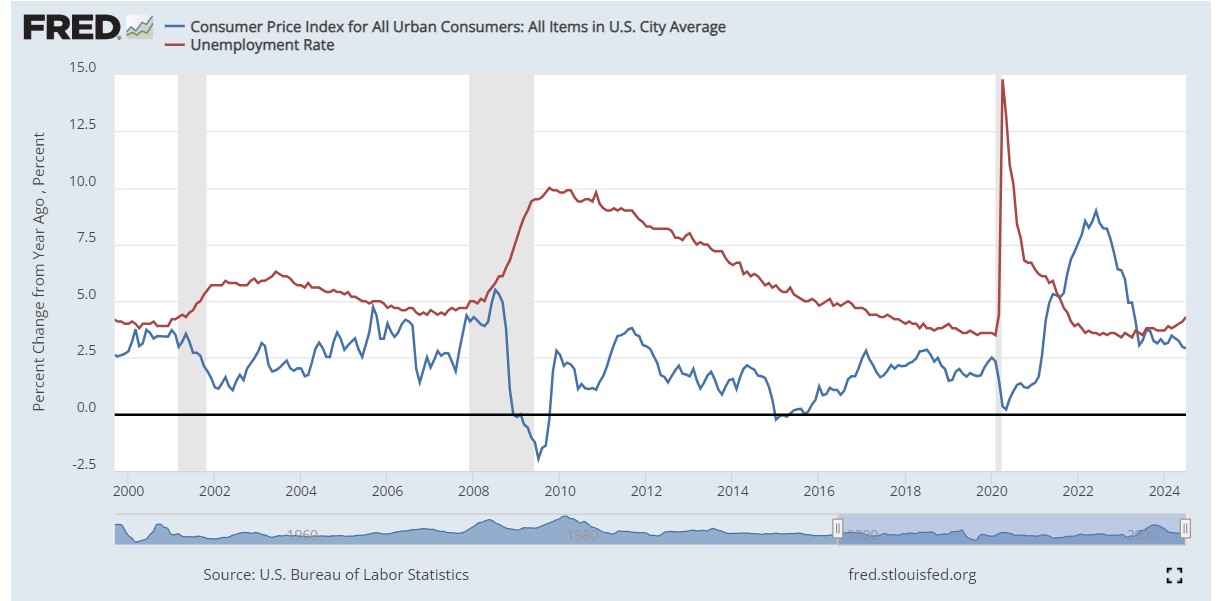
Explanations can be found (explanations can always be found). Supply shocks (like COVID 19 and the resulting supply chain disruption) have always been considered (or at least for the past 50 years) so the Phillips curve is a prediction equation with a large disturbance term. This may explain the recent large temporary increase and reduction. It also fits the small increase in 2011 and reduction in 2015 — I plotted headline CPI inflation including food and energy so world petroleum prices are a supply side disturbance.
High unemployment can correspond to low inflation but not deflation (negative inflation) if there is downward nominal rigidity (workers are unwilling to accept lower nominal wages and firms are reluctant to cut prices). There is overwhelming evidence for downward nominal rigidity. US consumer price inflation never reached zero. This can be explained if one notes that there are different markets for different goods and services in different states and there will be positive inflation if some have demand low enough that prices would be cut except for downward nominal rigidity and others have demand high enough that prices are raised.
Even in theory, any inflation rate is consistent with low unemployment (unemployment at the non *accelerating* rate of inflation). The change in inflation with low unemployment is not inconsistent with the Phillips curve.
Basically the two explanations rely on the fact that the Phillips curve is a curve. Even in Pillips’s orgiginal scatter there was a very large range of inflation corresponding to unemployment, one period of high unemployment with wage changes going to zero and only the great depression with actual nominal wage declines. A convex curve which is asymptotically vertical at the NAIRU and zero (or close) at high unemployment (and then breaking through to deflation at extremely high unemployment)
But an equation with ex poste explained exceptions all the time it might be useful is not useful.
The real problem is that macroeconomists don’t have much else. Even within the paleo Keynesian school of thought dramatically different predictions were made in 2021.
I will discuss them tomorrow