Does Steady GDP Growth “Prove” that Market Monetarists Are Right About Ineffective Fiscal Policy and Foolish Keynesianism?
You’re seeing a lot of crowing these days from the likes of Scott Sumner, David Beckworth, Lars Christensen, et al., claiming that fiscal austerity has obviously had no effect on GDP growth.
“Look!” they say: “Even with the sequester and all the other government spending cuts, growth in 2013 has been the same as 2012! The notion that government spending affects GDP growth (“Keynesianism”) is obviously false and stupid.”
As Scott says in a recent post:
The left predicts fiscal austerity will slow the recovery, and yet both GDP and jobs are actually a bit ahead of the 2012 pace so far this year.
This is specious reasoning.
1. The “left” prediction has been that “fiscal austerity will will slow the recovery” relative to what it would be otherwise, not relative to 2012, or Q1 2012. Scott, not the lefties, chose 2012 as the benchmark. But I know they know: when you compare 2012 to 2013, ceteris is not paribus.
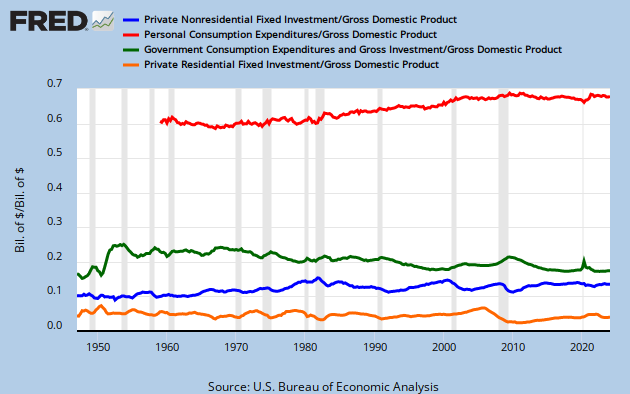
Look at the four highlighted numbers here, showing growth/decline in the two GDP-component numbers that dominate our economy:
| Chained 2005 $, %, AR | Q1’13 (2nd Estimate) | Q1’13 (Advance) | Q4’12 | Q3’12 | Q1 Y/Y | 2012 | 2011 | 2010 |
|---|---|---|---|---|---|---|---|---|
| Gross Domestic Product | 2.4 | 2.5 | 0.4 | 3.1 | 1.8 | 2.2 | 1.8 | 2.4 |
| Inventory Effect | 0.6 | 1.0 | -1.5 | 0.7 | -0.1 | 0.2 | -0.2 | 1.5 |
| Final Sales | 1.8 | 1.5 | 1.9 | 2.4 | 1.9 | 2.1 | 2.0 | 0.9 |
| Foreign Trade Effect | -0.2 | -0.5 | 0.3 | 0.4 | 0.2 | 0.1 | 0.2 | -0.4 |
| Domestic Final Sales | 1.9 | 1.9 | 1.5 | 1.9 | 1.7 | 1.9 | 1.8 | 1.3 |
| Demand Components | ||||||||
| Personal Consumption | 3.4 | 3.2 | 1.8 | 1.6 | 2.1 | 1.9 | 2.5 | 1.8 |
| Business Fixed Investment | 2.2 | 2.1 | 13.1 | -1.8 | 4.1 | 8.0 | 8.6 | 0.7 |
| Residential Investment | 12.0 | 12.6 | 17.5 | 13.6 | 12.8 | 12.1 | -1.4 | -3.1 |
| Government Spending | -4.9 | -4.1 | -7.0 | 3.9 | -2.3 | -1.7 | -3.1 | 0.6 |
| Chain-Type Price Index | ||||||||
| GDP | 1.1 | 1.2 | 1.0 | 2.7 | 1.6 | 1.8 | 2.1 | 1.3 |
| Personal Consumption Expenditures | 1.0 | 0.9 | 1.6 | 1.6 | 1.2 | 1.8 | 2.4 | 1.9 |
| PCE less Food & Energy | 1.2 | 1.2 | 1.0 | 1.1 | 1.3 | 1.7 | 1.4 | 1.5 |
Personal consumption growth (roughly 70% of the economy) is way up. Shouldn’t we expect 2013 to be kicking 2012’s anemic little butt? You gotta ask: If government spending (20% of GDP) weren’t such a drag, would we (finally) be experiencing robust growth? (Business investment growth also dropped, but 1. it remained positive, still adding to growth, and 2. it’s only 10% of the economy. Residential investment is less than 5%.)
See here, from one far better-credentialed than I:
“All else being equal, growth in 2013 should be better than 2012, because the headwinds holding it back are diminishing,” said Michelle Girard, chief economist of RBS. “The impact of the fiscal drag isn’t things getting worse, it’s the absence of things getting much better.”
2. The market monetarists’ whole theory is that fiscal policy doesn’t matter (nor, apparently, does anything else) because the Fed will always offset it with monetary policy. So according to their theory, the steady GDP growth is because the Fed has offset the fiscal drag.
But: the Fed has made basically zero changes to policy or guidance since its big announcement on December 12 ($85 billion in Treasury/MBS purchases until unemployment’s below 6.5% or inflation’s at 2.5%), except to state unequivocally that “fiscal policy is restraining economic growth.”
Now maybe the market monetarists want to argue that the December 12 announcement was pre-emptive, proleptically adjusting for the sequester etc. that hadn’t even been legislated yet. In which case their theory would be correct. But that’s suggesting a remarkably prescient reaction function by the Fed, one that I don’t think even market monetarists would want to lay claim to.
Cross-posted at Asymptosis.
it aint over till it’s over…sequester is just starting to be felt, and April PCE was just reported down 0.2%
We will be in recession in 2014 as the deficits decline, and CAD increases. Growth in 2012 was nothing to write home about, unemployment is still horrible and fragile. Wasn’t GDP just revised downward.
Austerity won’t kick in overnight. I’d say you can have a 1-2 year lag.
And Obama should worry if there is a recession around mid-term elections.
There was an income surge at the end of 2012 due to coming tax changes in 2013. That income surge was spent and invested in the 1stQ-2013. We see that in the numbers. That spending is fading out. and sequestration started only on March 1st. We will see personal consumption back off and today’s numbers show it.
For me Scott Sumner is disregarding important factors.
My view on nominal GDP targeting is that it would push us up against the effective demand limit too soon now. Maybe it would have been good to use their prescription when there was lots of spare capacity two years ago, but the dynamics of inflation and labor costs are more limited now.
http://effectivedemand.typepad.com/ed/2013/05/aggregate-supply-effective-demand-model-points-of-price-dynamics.html
@Edward Lambert: “There was an income surge at the end of 2012 due to coming tax changes in 2013.”
Can you explain more? Are you talking about people taking cap gains? Not technically “income,” but….
Can you quantify this?
“That income surge was spent and invested in the 1stQ-2013.”
Makes sense, but: Please be clear on “invested.” Fixed investment (actual spending), or financial “investment”? (The latter being largely immaterial to growth/GDP/demand–just asset trades/portfolio rebalancing, perhaps with some uncertain second- or third-order effects on the real economy…)
In any case, if rich people took cap gains in late ’12 and spent some portion of them in early ’13, that could explain some of the bump in PCE growth.
@Matt:
Agree 100%.
@rjs:
Agree 100% with you too.
re what edward lambert said, steve; it wasnt just cap gains at year end; companies pulled their bonuses back, and many declared special dividends; it shows up as a big blip on DPI:
http://research.stlouisfed.org/fred2/graph/?graph_id=113952&category_id=0
@rjs:
Thanks, very interesting. But it says otherwise than Edward. Both the income and the spending were in ’12. Is this perhaps just an I=E post-hoc stylized artifact?
not sure i get you, steve; maybe you misread my chart; it’s savings (green) that fluctuates with income every month, while spending (the red line) moved fairly steadily upward (until this month)
i didnt have any disagreement with what edward said, and i cover that income & outlays report from the BEA every month…conveniently, the current press release shows the monthly percentage change in DPI & PCE going back to december:
http://www.bea.gov/newsreleases/national/pi/pinewsrelease.htm
@rjs: “it’s savings (green) that fluctuates with income every month”
Ah right.
@Steve Roth I agree 100% with this post.
hey steve, that damn 2.4% first quarter GDP is mostly an artifact of seasonal adjustment….the increase in FARM INVENTORIES added .84 to GDP in the first quarter, & you know that didnt come from farmers filling their silos with corn harvested in january; it was just the seasonal comparison to the drought related weak 3rd & 4th quarter inventories that boosted GDP in the first;quarter..
see table 2:
http://www.bea.gov/newsreleases/national/gdp/2013/txt/gdp1q13_2nd.txt
What do you make of this post? http://macromarketmusings.blogspot.com/2013/05/the-seen-and-unseen-structural-budget.html
@Macroman2:
It doesn’t address the (difficult) question: what would GDP growth have been without the austerity? We’ve had a tepid recovery, AD still way below capacity, not converging (except maybe from the top down, with capacity declining). Why?
http://www.washingtonmonthly.com/political-animal-a/2013_06/american_austerity045046.php
Ryan Cooper citing this post