Insurer Financial Performance in 2023
You will read more on the profitability of healthcare plans as detailed by KFF. A brief introduction to this issue in an article by KFF.
In 2023, per enrollee gross margins were highest in the Medicare Advantage market, and medical loss ratios were lowest in the individual insurance market. While both gross margins and medical loss ratios are indicators of financial performance, higher margins and lower loss ratios do not necessarily translate into greater profitability since they do not account for administrative expenses or tax liabilities. Yes, the article does say gross margins and MLRs are indicators of financial performance. It also says such may not translate to greater profitability. Advantage plans set their costs, overheads, and profits for areas they bid. It would be unlikely they would be losing money. More of presentation of detail in 2023.
“Health Insurer Financial Performance in 2023,” KFF
The largest private health insurance companies can offer plans in multiple markets which includes Medicare Advantage, Medicaid managed care, individual (non-group), and fully insured group (employer) health insurance markets. Each market has unique features, including eligibility, payment, and coverage rules, which affect insurers’ overhead and potential profit. In recent years, private insurers are playing a growing role in public insurance programs. More than half of eligible Medicare beneficiaries enroll in a private Medicare Advantage plan and nearly three-quarters of Medicaid enrollees obtaining coverage through a managed care plan (typically a private insurer).
This brief examines two measures of financial performance:
- gross margins and medical loss ratios, and
- in the Medicare Advantage, Medicaid managed care, individual, and fully insured group health insurance markets using data reported by insurance companies to the National Association of Insurance Commissioners (NAIC) (compiled by Mark Farrah Associates), through the end 2023 (the most recent year of annual data).
In 2023, per enrollee gross margins were highest in the Medicare Advantage market, and medical loss ratios were lowest in the individual insurance market. While both gross margins and medical loss ratios are indicators of financial performance, higher margins and lower loss ratios do not necessarily translate into greater profitability since they do not account for administrative expenses or tax liabilities.
The increasingly complex structure of insurance companies, including the rise in consolidation and vertical integration, and role of subsidiaries, make it difficult to isolate the revenues and expenses associated with a particular insurance market. (Description of each market is in the Appendix).
Measures of Financial Performance in 2023
Gross margins
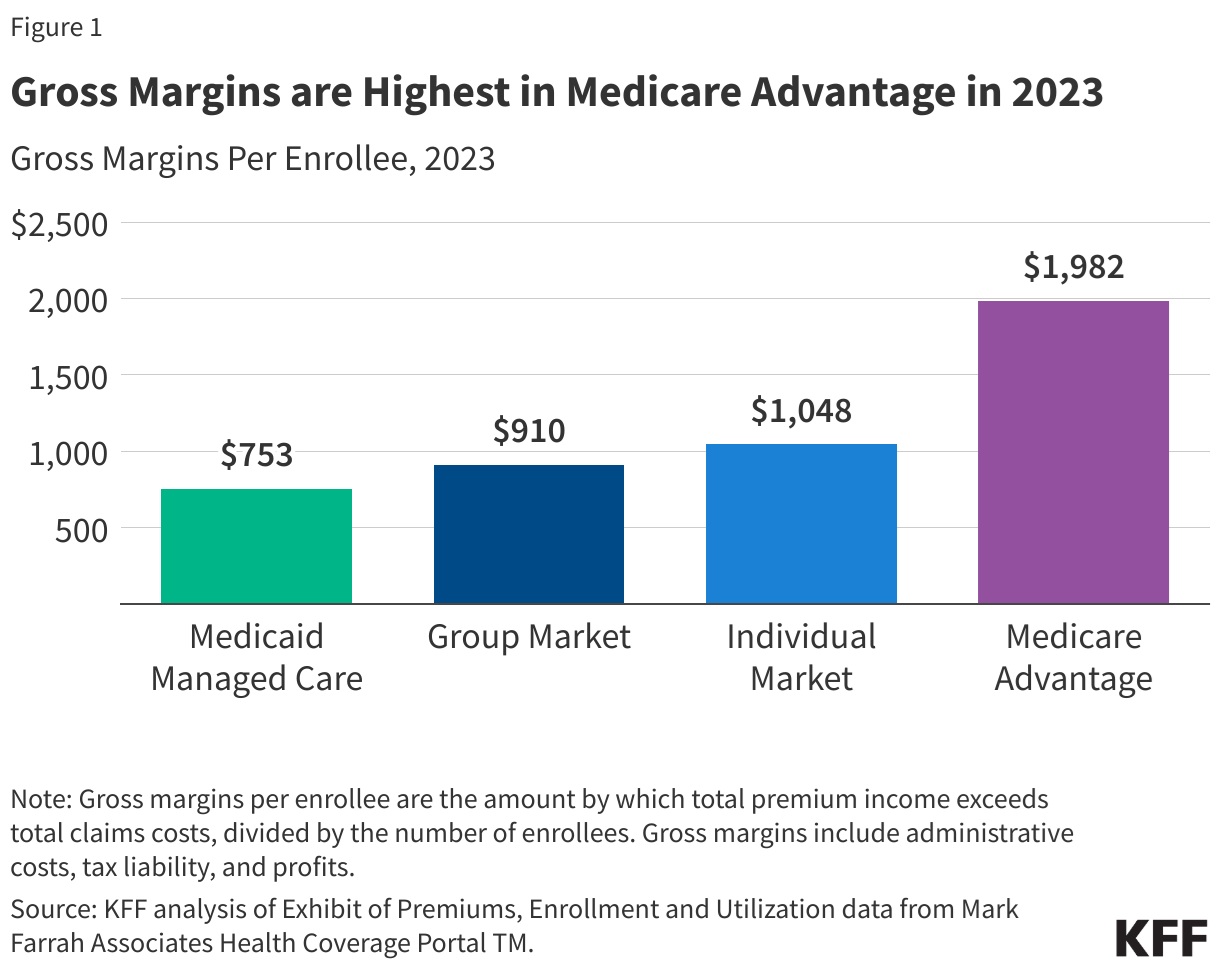
The gross margin per enrollee is the amount by which total premium income exceeds total claims costs per person over a specified time period (i.e., per year).
At the end of 2023, gross margins per enrollee ranged from $753 in the Medicaid managed care market to $1,982 in the Medicare Advantage market. Gross margins per enrollee in the group and individual markets were $910 and $1,048, respectively, roughly half the level observed among Medicare Advantage plans on average. The level of margins reflect, in part, the overall health needs and spending in a market segment. A similar margin in percentage terms will translate to a higher margin in dollars per enrollee when average health expenses are higher.
Medical loss ratios
Another way to assess insurer financial performance is to look at medical loss ratios (MLRs), or the percent of premium income that insurers pay out in the form of medical claims. Generally, lower MLRs mean that insurers have a higher share of income remaining after paying medical costs to use for administrative costs or keep as profits. Each health insurance market has different administrative needs and costs, so a lower MLR in one market does not necessarily mean that market is more profitable than another market.
MLRs are used in state and federal insurance regulation in a variety of ways. In the commercial insurance (individual and group) markets, insurers must issue rebates to individuals and businesses if their MLRs fail to reach minimum standards set by the ACA. Medicare Advantage insurers are required to report MLRs at the contract level (which typically combines multiple plans) and are required to issue rebates to the federal government if their MLRs fall short of required levels and are subject to additional penalties if they fail to meet MLR requirements for multiple consecutive years.
For Medicaid managed care organizations (MCOs), CMS requires states to develop capitation rates for Medicaid to achieve an MLR of at least 85%. There is no federal requirement for Medicaid plans to pay remittances if they fail to meet their MLR threshold, but a majority of states that contract with MCOs require remittances in at least some cases. The 2024 Consolidated Appropriations Act includes a financial incentive to encourage certain states to collect remittances from Medicaid MCOs that do not meet minimum MLR requirements.
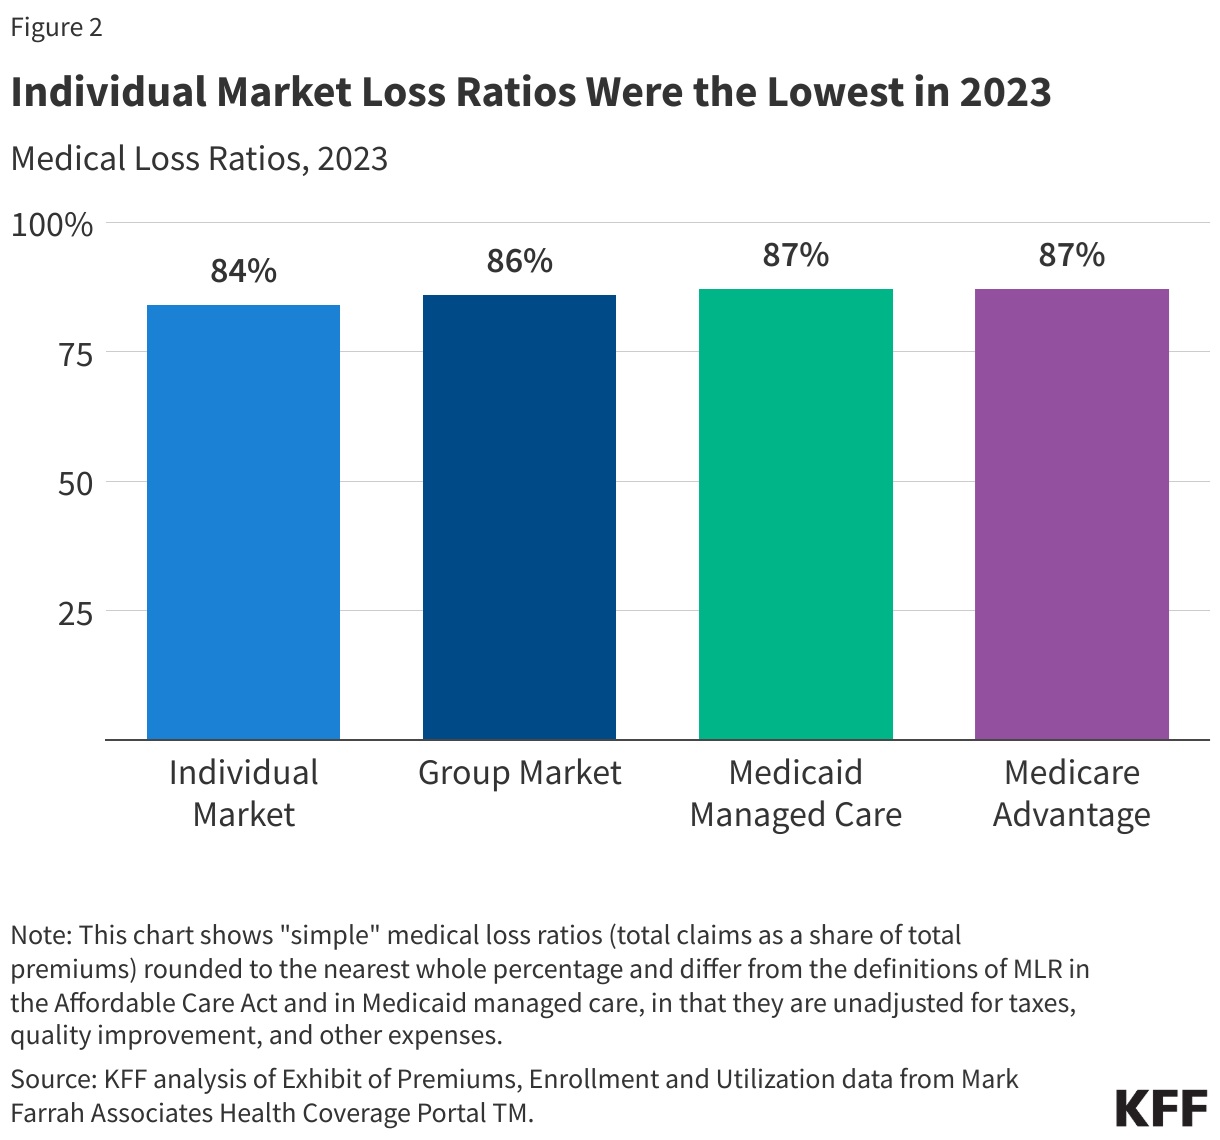
The MLRs shown in this issue brief are simple loss ratios (claims as a share of premium income) and differ from the definition of MLR in the ACA and in Medicaid managed care, which makes some adjustments for quality improvement and taxes, and do not account for reinsurance, risk corridors, or risk adjustment payments.
In 2023, MLRs were similar across the group, Medicare Advantage, and Medicaid managed care markets and somewhat lower in the individual market. Simple loss ratios were around 84% in individual market, 86% in the fully insured (group) market, and 87% in the Medicaid managed care and Medicare Advantage markets.
Trends in Gross Margins
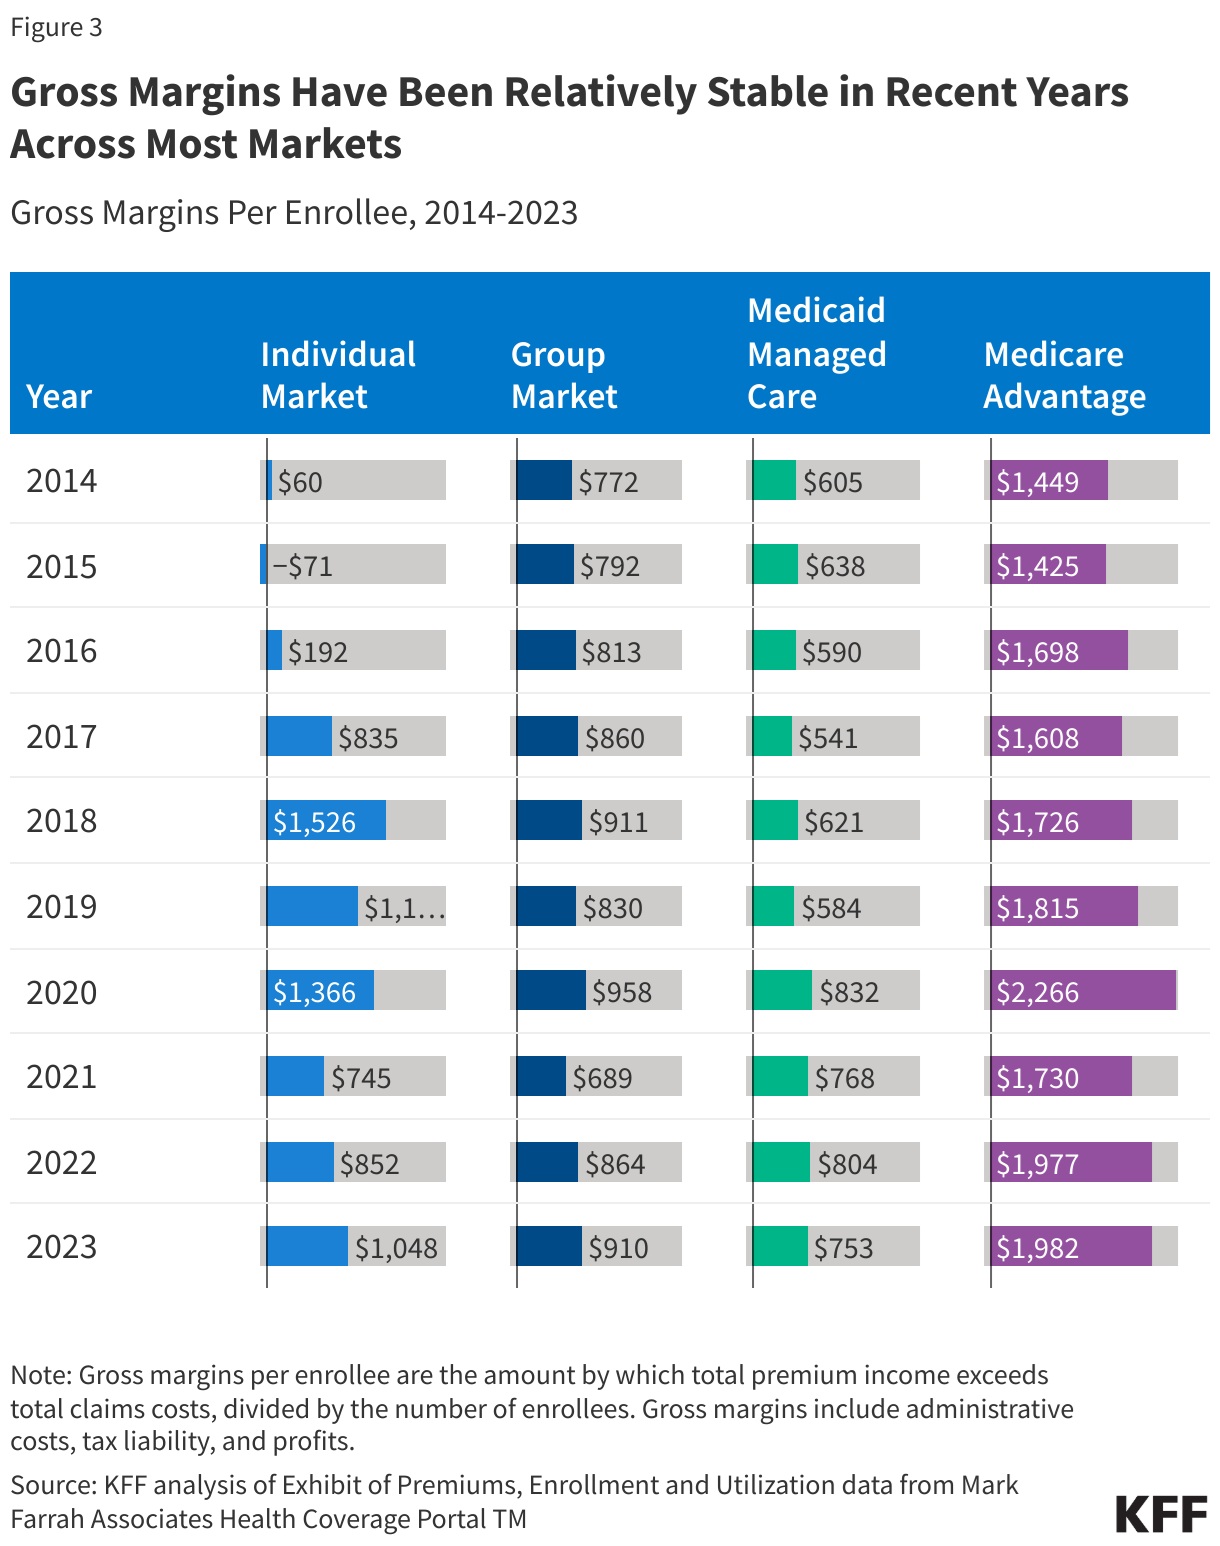
While gross margins are not equivalent to profitability, changes in gross margins can be indicative of changes in profitability (assuming administrative costs and tax liability are stable). Across most markets, gross margins have been relatively stable in recent years, though they have declined somewhat from spikes that occurred in 2020 during the initial phase of the COVID-19 pandemic.
Medicare Advantage: Through the end of 2023, gross margins in the Medicare Advantage market averaged $1,982 per enrollee, which was similar to 2022 ($1,977), despite reports by the largest Medicare Advantage insurers of higher-than-expected utilization at the end of 2023. Potentially spurred by the prospect of strong financial returns, the Medicare Advantage market has grown substantially in the last decade, with more than 50% of eligible beneficiaries enrolled in a Medicare Advantage plan in 2023.
Group Market: Gross margins for fully insured group plans declined significantly from 2020 to 2021 (the lowest in the past decade) but have been increasing in subsequent years. In 2023, per enrollee gross margins in the group market were nearly the same as those in 2018.
Individual Market: Individual market gross margins were about 31% and 10% lower in 2023 than in 2018 and 2019, respectively. In 2018, following efforts to repeal the ACA and defunding of Cost Sharing Reduction subsidies, insurers raised individual market premiums substantially. These premium increases resulted in significantly higher margins than in earlier years (Figure 3).
Medicaid Managed Care: Per enrollee gross margins in the Medicaid managed care market decreased by 6% from 2022 to 2023 but remained higher than pre-pandemic levels. Starting in April 2023, pandemic-era policies that allowed for “continuous enrollment” in Medicaid ended and states began reviewing eligibility and disenrolling individuals who were no longer eligible or who did not complete the renewal process. National data show total Medicaid/CHIP enrollment declined by more than 9% (about 9 million people) from March 2023 to December 2023.
Medicaid managed care plans expected the overall risk profile (or “acuity”) of its members to worsen during unwinding, as they anticipated “stayers” would be sicker than “leavers,” which may have contributed to the decrease in per enrollee gross margins seen from 2022 to 2023. States may use a variety of risk mitigation strategies to provide financial protection and limits on financial risk for states and plans that may not be accounted for in the data used in this analysis. Many states implemented COVID-19 related risk corridors (where states and health plans agree to share profit or losses) allowing for the recoupment of payments made for 2020, 2021, and 2022. Gross margins reported may not reflect recoupments of funds that may occur after the reporting period.
Medical Loss Ratios (MLRs) are the percent of premium income insurers pay out in the form of medical claims. A lower MLRs could mean insurers have a higher share of income remaining after paying medical costs to use for administrative costs or keep as profits. A higher MLR indicates a higher proportion of expenditures on direct patient care. Depicted in “Trends in Medical Loss Ratios” are a series of four charts. I took the liberty to display akk four of them in one JPEG so as to allow you to see the differences.
Trends in Medical Loss Ratios
Each health insurance market has different administrative needs and costs, so similar MLRs do not imply that the markets are similar to each other in profitability. Additionally, simple MLRs examined in this brief do not incorporate the effects of changes in tax law, such as the health insurer tax, which has been permanently repealed starting in 2021, was in effect in 2018 and 2020, but was not in 2019. MLRs alone cannot convey whether a market is profitable in a particular year. If administrative costs hold mostly constant from one year to the next, a change in the MLR could imply a change in profitability. The following chart was modified so as to show all categories and eliminate having to click from each category.
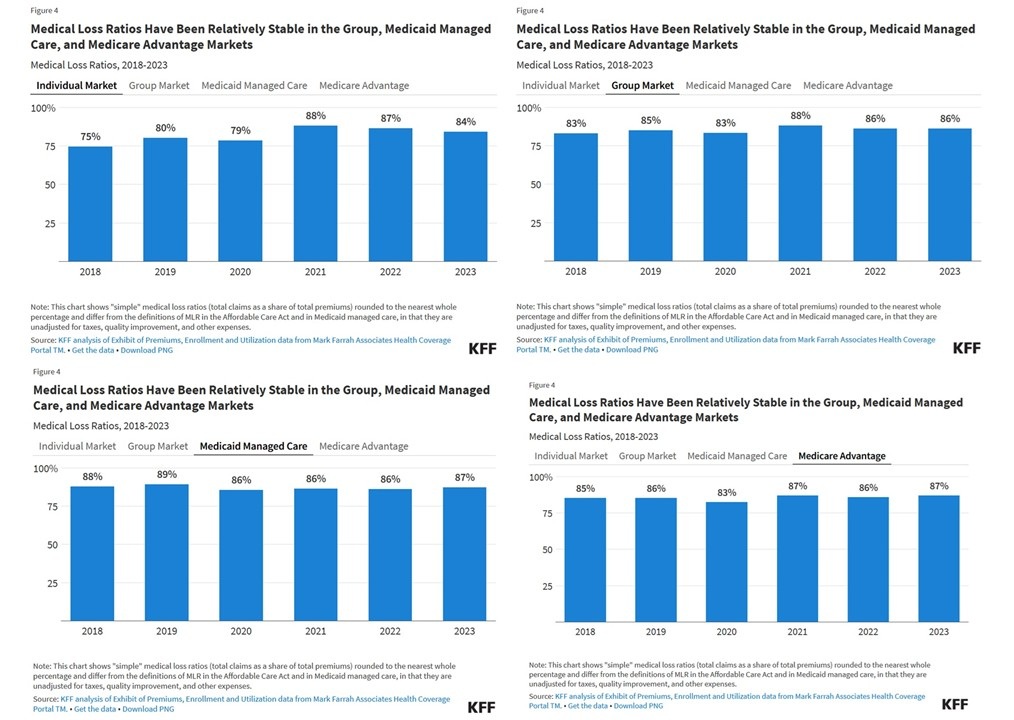
Individual Market: The average individual market MLR in 2023 was lower than in 2021 and 2022 but higher than those seen in the years leading up to the pandemic. As mentioned earlier, 2018 and 2019 were exceptionally lucrative years for the individual market. Many plans fell short of the ACA’s MLR requirements and were therefore required to issue large rebates to consumers based on their 2018 and 2019 experience.
Group Market: The average MLR for group plans was stable between 2022 and 2023 at 86%, and slightly below the average of 88% in 2021. These are all higher than previous years, when MLRs ranged from 83% in 2018 and 2020 to 85% in 2019.
Medicaid Managed Care: Relative to 2022, the average MLR in 2023 for the Medicaid managed care market increased slightly from 86% to 87% (implying a potential decrease in profitability) but remained lower than in 2018 and 2019. State Medicaid programs and managed care plans continue to be in a period of uncertainty as unwinding continues. States and plans will be closely monitoring disenrollments and “churn” (off and on the program) as well as new utilization and acuity trends.
Medicare Advantage: Average MLRs in the Medicare Advantage market have been relatively stable over the last few years, averaging 87% in 2021 and 2023 and 86% in 2022. That is somewhat higher than before and during the onset of the COVID-19 pandemic. The slight increase of the MLR in the Medicare Advantage market could imply decreased profitability. It is also possible that some Medicare Advantage insurers opted to offer new or more generous extra benefits, such as over-the-counter allowances, meals following hospital stays, or transportation, in addition to gym memberships, dental, vision and hearing benefits that are offered nearly universally to help retain and attract new enrollees.
They also ensure that those at risk of falling below the required thresholds would have sufficient costs to avoid triggering any rebates to the federal government. At the same time, it may be difficult to interpret changes in MLRs with increasing consolidation, driven in part by insurers purchasing related businesses, such as pharmacy benefit managers, physician groups, and post-acute care providers, because it is not entirely clear how insurers allocate expenses across different lines of business.
Medicare Advantage plans have both higher average costs and higher premiums (largely paid by the federal government), because Medicare covers an older, sicker population. So, while Medicare Advantage insurers spend a similar share of their premiums on benefits as other insurers in other markets, the gross margins described above (which include profits and administrative costs) tend to be higher in Medicare Advantage plans.
@John,
I spammed your comment for being off-topic. The topic isn’t Intel. Hijacking threads is one form of trolling. We don’t allow trolls on AB.The next time we have an open thread, you can post your random thoughts.