Global Oil Surplus Per Day as OPEC output fell to 1.049 million bpd below quota
RJS: Focus on Fracking
~~~~~~~
Summary: Global oil surplus at 560,000 barrels per day in May as OPEC output fell to 1.049 million bpd below quota
~~~~~~~
OPEC’s Report on Global Oil for May
Tuesday of this week saw the release of OPEC’s June Oil Market Report, which includes details on OPEC & global oil data for May, and hence it gives us a picture of the global oil supply & demand situation at a time when major cities in China were under restrictive Covid lockdowns, while at the same time exports of Russian oil were curtailed by sanctions imposed by the West….in light of those offsetting circumstances, OPEC and aligned oil producers had again agreed to increase their output by 400,000 barrels per day for a tenth consecutive month, ie the 10th such increase from the previously agreed to July 2021 level, which was in turn part of the fifth production quota policy reset that they’ve made over the past twenty-three months, all in response to the pandemic-related slowdown and subsequent irregular recovery….note that with the course and impact of the Ukraine war and the pandemic still uncertain, we consider the demand projections made herein to be pretty speculative, and hence will not address any projections beyond the May estimates..
The first table from this month’s report that we’ll review is from the page numbered 47 of this month’s report (pdf page 57), and it shows oil production in thousands of barrels per day for each of the current OPEC members over the recent years, quarters and months, as the column headings below indicate…for all their official production measurements, OPEC uses an average of production estimates by six “secondary sources”, namely the International Energy Agency (IEA), the oil-pricing agencies Platts and Argus, the U.S. Energy Information Administration (EIA), the oil consultancy Cambridge Energy Research Associates (CERA) and the industry newsletter Petroleum Intelligence Weekly, as a means of impartially adjudicating whether their output quotas and production cuts are being met, to thereby avert any potential disputes that could arise if each member reported their own figures…

As we can see on the bottom line of the above table, OPEC’s oil output decreased by 176,000 barrels per day to 28,508,000 barrels per day during May, down from their revised April production total that averaged 28,684,000 barrels per day….however, that April output figure was originally reported as 28,648,000 barrels per day, which therefore means that OPEC’s April production was revised 36,000 barrels per day higher with this report, and hence OPEC’s May production was, in effect, just 140,000 barrels per day lower than the previously reported OPEC production figure (for your reference, here is the table of the official April OPEC output figures as reported a month ago, before this month’s revision)…
As we can see from that table, the primary reason for the decrease in OPEC’s output in May was the 186,000 barrel per day drop in oil production from Libya, where demonstrations against the prime minister had further curtailed production in a country already impacted by repeated bouts of civil strife…but Libya wasn’t the cartel’s only problem; production fell in more than half its members, and left a deficit that the Saudis and the Emirates, the two OPEC members with surplus capacity, couldn’t make up.
According to the agreement reached between OPEC and the other oil producers at their Ministerial Meeting on July 18th, 2021, the oil producers party to that agreement were to raise their output by a total of 400,000 barrels per day each month through December 2021. This was subsequently renewed at monthly meetings to include further 400,000 barrel per day production increases in January, February, March, April, May and June of 2022, and which would indicate an increase of 254,000 barrels per day each month from the OPEC members listed above, with the rest of the 400,000 bpd supplied by other producers. including Russia….but OPEC’s decrease of 176,000 barrels per day nearly reversed their expected increase….and while the production decreases in Libya and Nigeria, which has ongoing pipeline theft and leakage problems, were obviously the major reason for the May decrease. several other OPEC members continue to be short of what they were expected to produce, as we’ll see in the next table..
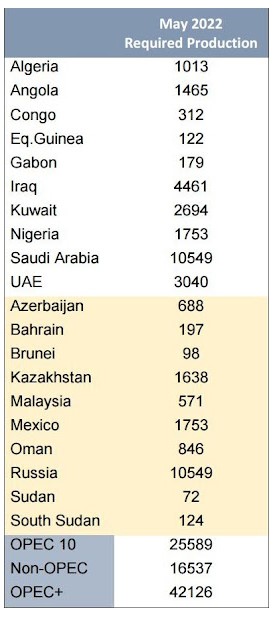
The adjacent table was originally included as a downloadable attachment to the press release following the 27th OPEC and non-OPEC Ministerial Meeting on March 31st, 2022, which set OPEC’s and other aligned producers’ production quotas for May, Since war torn Libya and US sanctioned producers Iran and Venezuela are exempt from the production cuts imposed by the joint agreement that governs the output of the other OPEC producers, they are not shown here, and OPEC’s quota is aggregated under the total listed for the ‘OPEC 10’, which you can see was expected to be at 25,589,000 barrels per day in May. Therefore, the 24,540,000 barrels those 10 OPEC members actually produced in May were 1,049,000 barrels per day short of what they were expected to produce during the month, with Nigeria and Angola accounting for most of this month’s shortfall, while only the UAE was able to produce what was expected of them…
* * *
Recall the original 2020 oil producer’s agreement was to jointly cut their oil production by 23%, or by 9.7 million barrels per day, from an October 2018 baseline for just two months early in the pandemic, during May and June of 2020, but that initial 9.7 million bpd production cut agreement was extended to include July 2020 at a meeting between OPEC and other producers on June 6th, 2020. Then, in a subsequent meeting in July of that year, OPEC and the other oil producers agreed to ease their deep supply cuts by 2 million barrels per day to 7.7 million barrels per day for August 2020 and subsequent months, which thus became the agreement that governed OPEC’s output for the rest of 2020. The OPEC+ agreement for their January 2021 production, which was later extended to include February and March and then April’s output, was to further ease their supply cuts by 500,000 barrels per day to a reduction of 7.2 million barrels per day from that original 2018 baseline . . . then, during a difficult meeting on April 1st of last year, OPEC and the other oil producers that are aligned with them agreed to incrementally adjust their oil production higher each month by a pre-set amount for each country over the following three months, thus extending their joint output cut agreement through July….production levels for August and the following months of last year were to be determined by a July 1st OPEC meeting, but that meeting was adjourned on July 2nd due to a dispute between the UAE and the Saudis over the 2018 reference production levels, and a subsequent attempt to restart that meeting on July 5th was called off….so it wasn’t until July 18th 2021 that a tentative compromise addressing August 2021’s output quotas was worked out, allowing oil producers in aggregate to increase their production by 400,000 barrels per day in August, and again by that amount in each of the following months, and also to boost reference production levels for the UAE, the Saudis, Iraq and Kuwait beginning in April 2022, which is now reflected in the OPEC production quota table you see above, and which now makes the effective monthly production increase 432,000 barrels per day . . . OPEC and other producers then agreed to increase their production in January 2022 by a further 400,000 barrels per day in a meeting concluded on the 2nd of December, 2021, and reaffirmed their intention to continue that policy with another 400,000 barrel per day increase in February at a meeting concluded January 4, 2022, and then agreed to stick to that 400,000 bpd oil output increase in March, despite pressure from the US to raise output more quickly, at a meeting on February 2nd….then, at a meeting on March 2nd, OPEC and its oil-producing allies, which included Russia, decided to hold their production increase at that level thru April in an OPEC+ meeting that only lasted 13 minutes, their shortest meeting ever…then on March 31, OPEC and aligned producers agreed to reaffirm the decisions of the prior Ministerial meetings and again limit their production increase for May to the agreed 400,000 barrels per day, because “the current [oil market]volatility is not caused by fundamentals, but by ongoing geopolitical developments”…then again, in an OPEC and non-OPEC Ministerial Meeting held on May 5th, they again reaffirmed the decision of the July18th 2021 meeting to increase production by 432,000 barrels per day in June of this year…most recently, however, in a meeting held June 2nd, they agreed to advance the 432,000 barrel per day increase scheduled for September, with that increase to be split evenly between July and August…hence, the production increase now scheduled for those two months is 648,000 barrels per day…
Hence OPEC arrived at the production quotas for August 2021 through MAY of this year by repeatedly readjusting the original 23%, or 9.7 million barrel per day production cut from the October 2018 baseline that they first agreed to for May and June 2020. First to a 7.7 million barrel per day output reduction from the baseline for the remainder of 2020, then to a 7.2 million barrel per day production cut from the baseline for the first four months of this year, which was subsequently raised to an 8.2 million barrel per day oil output reduction. After the Saudis unilaterally committed to cut their own production by a million barrels per day during the Covid surge of February, March, and then later during April of last year . . . under the agreement prior to the current one affecting this month, OPEC’s production cut in April 2021 was set at 4,564,000 barrels per day below the October 2018 baseline, which was lowered to a cut of 3,650,000 barrels per day from the baseline with the prior comprehensive agreement, which thus set the July production quota for the “OPEC 10” at 23,033,000 barrels per day, with war torn Libya and US sanctioned producers Iran and Venezuela exempt from the production cuts imposed by that agreement….for OPEC and the other producers to increase their output by 400,000 barrels per day from that July 2021 level, each producer would be allowed to initially increase their production by just over 1% per month since that time…for OPEC alone, that meant a 254,000 barrel per day increase for each month from July 2021 to April 2022, at which time the incremental 32,000 barrels per day adjustment they arrived at in July 2021 kicked iN…adding together those monthly increases since last July, when the quota was at 23,033,000 barrels per day, is how they arrived at the 25,589,000 barrels per day quota for OPEC for May that you see on the table above..
The next graphic from this month’s report that we’ll look at shows us both OPEC’s and worldwide oil production monthly on the same graph, over the period from June 2020 to May 2022, and it comes from page 48 (pdf page 58) of OPEC’s June Oil Market Report….on this graph, the cerulean blue bars represent OPEC’s monthly oil production in millions of barrels per day as shown on the left scale, while the purple graph represents global oil production in millions of barrels per day, with the metrics for global output shown on the right scale.

After this month’s 176,000 barrel per day decrease in OPEC’s production from their revised production of a month earlier, OPEC’s preliminary estimate is that total global liquids production decreased by a rounded 150,000 barrels per day to average 98.75 million barrels per day in May, a reported decrease which came after April’s total global output figure was apparently revised up by 160,000 barrels per day from the 99.74 million barrels per day of global oil output that was estimated for April a month ago, as non-OPEC oil production inched up by 23,000 barrels per day in May after that upward revision, as 400,000 barrels per day production growth in non-OPEC Eurasia and Latin American countries was offset by output decreases totaling 400,000 barrels per day by Canada and the UK…
Even after that decrease in May’s global output, the 98.75 million barrels of oil per day that were produced globally during the month were still 5.82 million barrels per day, or 6.2% more than the revised 93.93 million barrels of oil per day that were being produced globally in May a year ago, which was the first month that OPEC and their allied producers began their program of monthly production increases from the 7.2 million barrels per day production cut that had governed the production of the prior four months (see the June 2021 OPEC report (online pdf) for the originally reported May 2021 details)…with this month’s decrease in OPEC’s output greater than the global decrease, their May oil production of 28,508,000 barrels per day amounted to 28.9% of what was produced globally during the month, down from their revised 29.0% share of the global total in April….OPEC’s May 2021 production was reported at 25,463,000 barrels per day, which means that the 13 OPEC members who were part of OPEC last year produced 3,045,000 barrels per day, or 14.2% more barrels per day of oil this April than what they produced a year earlier, when they accounted for 27.2% of global output…
Even after the decrease in both OPECs and global oil output that we’ve seen in this report, the amount of oil being produced globally during the month was still more than the expected global demand, as this next table from the OPEC report will show us….

The above table came from page 28 of the June Oil Market Report (pdf page 38), and it shows regional and total oil demand estimates in millions of barrels per day for 2021 in the first column, and then OPEC’s estimate of oil demand by region and globally quarterly over 2022 over the rest of the table…on the “Total world” line in the third column, we’ve circled in blue the figure that’s relevant for May, which is their estimate of global oil demand during the second quarter of 2022….OPEC has estimated that during the 2nd quarter of this year, all oil consuming regions of the globe have been using an average of 98.19 million barrels of oil per day, which is a downward revision of 250,000 barrels per day from their estimate for 2nd quarter demand of a month ago (that revision is circled in green)…but as OPEC showed us in the oil supply section of this report and the summary supply graph above, OPEC and the rest of the world’s oil producers were producing 98.75 million barrels per day during May, which would imply that there was a surplus of around 560,000 barrels per day of global oil production in May, when compared to the demand estimated for the month…
In addition to figuring May’s global oil supply surplus that’s evident in this report, the downward revision of 250,000 barrels per day to second quarter demand that’s shown circled in green above, combined with the 160,000 barrel per day upward revision to April’s global oil supplies that’s implied in this report, means that the 300,000 barrels per day global oil output surplus we had previously figured for April would now be revised to a surplus of 710,000 barrels per day…those daily surpluses would follow the 230,000 barrels per day surplus we had figured for March, and the 10,000 barrels per day surplus we had figured for February…so despite the oil shortage concerns that have driven oil prices over $100 a barrel since the war began, the world’s oil producers have managed to produce more barrels of oil each day than anyone wanted over that entire span…