SPR and Supplies Low, Total Oil and Products the Same
RJS, Focus on Fracking
Summary: Strategic Petroleum Reserve at a 34 year low, US oil supplies at a 17 year low, total oil + products inventories at a 13½ year low
The Latest US Oil Supply and Disposition Data from the EIA
US oil data from the US Energy Information Administration for the week ending May 13th indicated that after a jump in our oil exports, another oil withdrawal from the SPR, and an increase in demand that could not be accounted for, we had to pull oil out of our stored commercial crude supplies for the 2nd time in 7 weeks, and for the 25th time in the past 42 weeks. Our imports of crude oil rose by an average of 299,000 barrels per day to an average of 6,568,000 barrels per day, after falling by an average of 62,000 barrels per day during the prior week. While our exports of crude oil rose by 641,000 barrels per day to 3,520,000 barrels per day during the week, which together meant that our trade in oil worked out to a net import average of 3,048,000 barrels of oil per day during the week ending May 13th, 342,000 fewer barrels per day than the net of our imports minus our exports during the prior week . . . over the same period, production of crude oil from US wells was reportedly 100,000 barrels per day higher at 11,900,000 barrels per day, and hence our daily supply of oil from the net of our international trade in oil and from domestic well production appears to have totaled an average of 14,948,000 barrels per day during the cited reporting week…
Meanwhile, US oil refineries reported they were processing an average of 15,935,000 barrels of crude per day during the week ending May 13th, an average of 239,000 more barrels per day than the amount of oil than our refineries processed during the prior week. While over the same period the EIA’s surveys indicated that a net of 1,201,000 barrels of oil per day were being pulled out of the supplies of oil stored in the US . . . so based on that reported & estimated data, this week’s crude oil figures from the EIA appear to indicate that our total working supply of oil from storage, from net imports and from oilfield production was 214,000 barrels per day more than what our oil refineries reported they used during the week. To account for that disparity between the apparent supply of oil and the apparent disposition of it, the EIA just inserted a (-214,000) barrel per day figure onto line 13 of the weekly U.S. Petroleum Balance Sheet in order to make the reported data for the daily supply of oil and for the consumption of it balance out, a fudge factor that they label in their footnotes as “unaccounted for crude oil”, thus suggesting there must have been an error or omission of that magnitude in this week’s oil supply & demand figures that we have just transcribed moreover, since last week’s EIA fudge factor was at (+719,000) barrels per day, that means there was a 933,000 barrel per day difference between this week’s balance sheet error and the EIA’s crude oil balance sheet error from a week ago, and hence the week over week supply and demand changes indicated by this week’s report are completely worthless . . . however, since most everyone treats these weekly EIA reports as gospel, and since these figures often drive oil pricing, and hence decisions to drill or complete oil wells, we’ll continue to report this data just as it’s published, and just as it’s watched & believed to be reasonably accurate by most everyone in the industry . . . (for more on how this weekly oil data is gathered, and the possible reasons for that “unaccounted for” oil, see this EIA explainer)….
The week’s 1,201,000 barrel per day decrease in our overall crude oil inventories left our total oil supplies at 958,804,000 barrels at the end of the week, our lowest oil inventory level since February 4th, 2005, and thus a 17 year low. This week’s oil inventory decrease came as 485,000 barrels per day were being pulled our commercially available stocks of crude oil, while 716,000 barrels per day of oil were being pulled out of our Strategic Petroleum Reserve at the same time . . . that draw on the SPR would now include the initial emergency withdrawal under Biden’s “Plan to Respond to Putin’s Price Hike at the Pump”, that is expected to supply 1,000,000 barrels of oil per day to commercial interests from now up to the midterm elections in November, in the hope of keeping gasoline and diesel fuel prices from rising further until that time, as well as the previous 30,000,000 million barrel release from the SPR to address Russian supply related shortfalls, and the administration’s earlier plan to release 50 million barrels from the SPR to incentivize US gasoline consumption. Since both the press releases from the administration on the SPR releases and the news coverage of them have been less than clear, we’ll again include here a copy of the SPR release schedule that the Congressional Research Service prepared for members of Congress, so that they’d be able to front-run Energy Department oil releases in their own trading accounts…

The Biden administration’s releases from the SPR fall under 3 categories, as shown above . . . the initial Biden SPR release was a combination of a mandatory sale and an exchange, wherein the oil companies receiving oil from the SPR would be expected to pay it back, while the most recent SPR release was all categorized as an emergency sale, meant to replace the Russian oil lost due to sanctions in the wake of the Ukraine situation . . . including other withdrawals from the Strategic Petroleum Reserve under recent release programs, a total of 118,165,000 barrels of oil have now been removed from the Strategic Petroleum Reserve over the past 22 months, and as a result the 537,984,000 barrels of oil still remaining in our Strategic Petroleum Reserve is now the lowest since November 27th, 1987, or at a 34 year low, as repeated tapping of our emergency supplies for non-emergencies or to pay for other programs has already drained those supplies considerably over the past dozen years. Furthermore, the total 180,000,000 barrel drawdown over the next six months will remove almost a third of what remains in the SPR, and leave us with what would be less that a 20 day supply of oil at today’s consumption rate..
Further details from the weekly Petroleum Status Report (pdf) indicate that the 4 week average of our oil imports rose to an average of 6,276,000 barrels per day last week, which was 4.7% more than the 5,961,000 barrel per day average that we were importing over the same four-week period last year . . . this week’s crude oil production was reported to be 100,000 barrels per day higher at 11,900,000 barrels per day because the EIA’s rounded estimate of the output from wells in the lower 48 states was 100,000 barrels per day higher at 11,500,000 barrels per day, while Alaska’s oil production was unchanged at 447,000 barrels per day and had no impact on the final rounded national total. US crude oil production had reached a pre-pandemic high of 13,100,000 barrels per day during the week ending March 13th 2020, so this week’s reported oil production figure was 9.2% below that of our pre-pandemic production peak, but was 41.2% above the interim low of 8,428,000 barrels per day that US oil production had fallen to during the last week of June of 2016…
US oil refineries were operating at 91.8% of their capacity while using those 15,935,000 barrels of crude per day during the week ending May 13th, up from the 90.0% utilization rate of the prior week, and close to the historical utilization rate for mid May refinery operations . . . the 15,935,000 barrels per day of oil that were refined this week were 5.4% more barrels than the 15,116,000 barrels of crude that were being processed daily during week ending May 14th of 2021, and 23.5% more than the 12,903,000 barrels of crude that were being processed daily during the week ending May 15th, 2020, when US refineries were operating at what was then a much lower than normal 69.4% of capacity during the first wave of the pandemic, but still 4.4% less than the 16,676,000 barrels that were being refined during the prepandemic week ending May 10th 2019, when refinery utilization was at a bit below normal 90.5% for the second weekend of May…
Even with the increase in the amount of oil being refined this week, gasoline output from our refineries was a somewhat lower, decreasing by 142,000 barrels per day to 9,574,000 barrels per day during the week ending May 13th, after our gasoline output had increased by 27,000 barrels per day over the prior week. This week’s gasoline production was 1.8% less than the 9,753,000 barrels of gasoline that were being produced daily over the same week of last year, and 3.4% below our gasoline production of 9,912,000 barrels per day during the week ending May 10th, 2019, ie, the year before the pandemic impacted gasoline output . . . at the same time, our refineries’ production of distillate fuels (diesel fuel and heat oil) decreased by 2,000 barrels per day to 4,880,000 barrels per day, after our distillates output had increased by 163,000 barrels per day over the prior week…and after recent increases, our distillates output was 7.2% more than the 4,553,000 barrels of distillates that were being produced daily during the week ending May 14th of 2021, but still 4.1% less that the 5,264,000 barrels of distillates that were being produced daily during the week ending May 10th, 2019…
With the decrease in our gasoline production, our supplies of gasoline in storage at the end of the week fell for the thirteenth time in fifteen weeks, decreasing by 4,779,000 barrels to 220,189,000 barrels during the week ending May 13th,after our gasoline inventories had decreased by 3,607,000 barrels over the prior week . . . our gasoline supplies decreased again this week because the amount of gasoline supplied to US users increased by 325,000 barrels per day to 9,027,000 barrels per day, while our imports of gasoline rose by 181,000 barrels per day to 876,000 barrels per day and while our exports of gasoline rose by 15,000 barrels per day to 957,000 barrels per day. But even with 14 inventory drawdowns over the past 15 weeks, our gasoline supplies were still only 6.0% lower than last May 14th’s gasoline inventories of 234,226,000 barrels, and 8% below the five year average of our gasoline supplies for this time of the year…
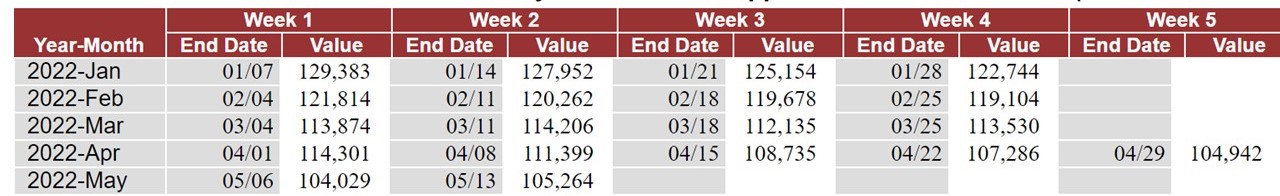
However, even with our distillates production little changed, our supplies of distillate fuels increased for the 4th time in eighteen weeks and for the 11th time in thirty-seven weeks, rising by 1,235,000 barrels to 105,264,000 barrels during the week ending May 13th, after our distillates supplies had decreased by913,000 barrels to a 17 year low during the prior week . . . our distillates supplies rose this week even though the amount of distillates supplied to US markets, an indicator of our domestic demand, rose by 39,000 barrels per day to 3,816,000 barrels per day, because our exports of distillates fell by 355,000 barrels per day to 1,357,000 barrels per day, while our imports of distillates fell by 8,000 barrels per day to 114,000 barrels per day . . . but after forty-one inventory withdrawals over the past fifty-eight weeks, our distillate supplies at the end of the week were 20.3% below the 132,095,000 barrels of distillates that we had in storage on May 7th of 2021, and about 22% below the five year average of distillates inventories for this time of the year…
Meanwhile, with this week’s increase in our oil exports and an increase in unexplained demand, our commercial supplies of crude oil in storage fell for the 15th time in 25 weeks and for the 33rd time in the past year, decreasing by 3,394,000 barrels over the week, from 424,214,000 barrels on May 6th to 420,820,000 barrels on May 13th, after our commercial crude supplies had increased by 8,487,000 barrels over the prior week . . . with this week’s decrease, our commercial crude oil inventories fell to about 14% below the most recent five-year average of crude oil supplies for this time of year, but were still about 18% above the average of our crude oil stocks as of the second weekend of May over the 5 years at the beginning of the past decade, with the disparity between those comparisons arising because it wasn’t until early 2015 that our oil inventories first topped 400 million barrels . . . since our crude oil inventories had jumped to record highs during the Covid lockdowns of spring 2020, and then jumped again after last year’s winter storm Uri froze off US Gulf Coast refining, our commercial crude oil supplies as of this May 13th were 13.4% less than the 486,011,000 barrels of oil we had in commercial storage on May 14th of 2021, and were also 20.8% less than the 531,476,000 barrels of oil that we had in storage on May 15th of 2020, and 10.8% less than the 472,035,000 barrels of oil we had in commercial storage on May 10th of 2019…
Finally, with our inventories of crude oil and our supplies of all products made from oil remaining near multi year lows, we are also continuing to keep track of the total of all U.S. Stocks of Crude Oil and Petroleum Products, including those in the SPR . . . the EIA’s data shows that the total of our oil and oil product inventories, including those in the Strategic Petroleum Reserve and those held by the oil industry, and thus including everything from gasoline and jet fuel to propane/propylene and residual fuel oil, fell by 7,939,000 barrels this week, from 1,699,318,000 barrels on May 6th, 1,691,379,000 barrels on May 13th, after our total inventories had risen by 2,898,000 barrels during the prior week . . . that left our total liquids inventories down by 97,054,000 barrels over the first 18 weeks of this year, and at the lowest since Nov 14, 2008, or at a 13 1/2 year low…
this is quite a story…
you know how we’re sending all that LNG to Europe to replace Russian gas, right? trouble is, the countries that need it most, like Germany, have no or just a few regasification terminals, so there’s no place to unload the LNG on the continent…so they just dump in the UK, who has three unloading terminals….and there it sits, coming out of the Brit’s ears..