Real retail sales signal further expansion, but also continue to suggest slower payrolls growth ahead
Real retail sales signal further expansion, but also continue to suggest slower payrolls growth ahead
Nominal retail sales for the month of April were up 0.9%, and previous months were revised higher. That means that, after inflation, real retail sales for April were up 0.6%, a very positive number.
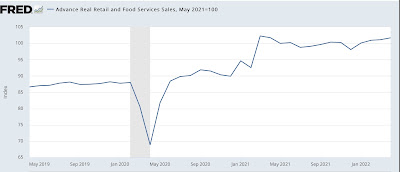
Yesterday I wrote that, rather than a YoY comparison with last April, during the stimulus spending spree, the more important comparison was with last May. Although the direct YoY comparison is absolutely unchanged, vs. last May real retail sales were up 1.7%:
This is consistent with a relatively slow consumer-fueled expansion (a moderate expansion would be a number more like 2.5%-3.0% YoY), and not consistent with any imminent recession.
Next let’s turn to employment because real retail sales are also a good short leading indicator for jobs.
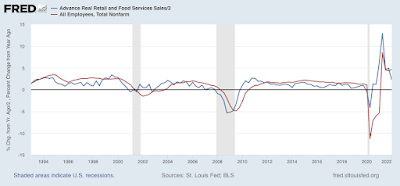
As I have written many times over the past 10+ years, real retail sales YoY/2 has a good record of leading jobs YoY with a lead time of about 3 to 6 months. That’s because demand for goods and services leads to the need to hire employees to fill that demand. The exceptions have been right after the 2001 and 2008 recessions, when it took jobs longer to catch up, as shown in the graph below, averaged quarterly through the First Quarter:
Now here is the monthly YoY comparison through April:
The above graph is an excellent way to compare the relationship in a more normal expansion, viz., 2019, where real retail sales/2 was in the .3%-1.0% range, vs. last year, where they were in the 5% range. I have been expecting the blowout job numbers of about 500,000 per month to end in several months. This report is more evidence for that since the comparison with last May is 0.85%. This suggests that monthly job gains are going to slow down to a range of about 100,000-300,000 per month by early autumn.
Finally, real retail sales per capita is one of my long leading indicators. Here’s what it looks like for the past 25 years:
These are up 1.4% since last May, and the highest of all time except for March and April 2021. While for that reason I can’t call these a positive, the recent rebound in no way resembles their declining pattern before the last two recessions and switches the long leading signal from negative to neutral for this metric.


