Daily Global Oil Surplus despite OPEC Production Short Fall
RJS Summary; Global oil surplus at 710,000 barrels per day in March despite OPEC’s 821,000 barrel per day production shortfall
OPEC’s Report on Global Oil for March
Tuesday of the past week saw the release of OPEC’s April Oil Market Report, which includes details on OPEC & global oil data for March, and hence it gives us a picture of the global oil supply & demand situation after OPEC and aligned oil producers agreed to increase their output by 400,000 barrels per day for an eighth consecutive month, ie from the previously agreed to July 2021 level, which was in turn part of the fifth production quota policy reset that they’ve made over the past twenty-two months, all in response to the pandemic-related slowdown and subsequent irregular recovery . . . note that now with the course and impact of the Ukraine war uncertain, we consider the demand projections made herein, which are only modestly lower than in the prior report, to be purely speculative, and hence will not address any projections beyond the March estimates..
The first table from this monthly report that we’ll review is from the page numbered 45 of this month’s report (pdf page 55), and it shows oil production in thousands of barrels per day for each of the current OPEC members over the recent years, quarters and months, as the column headings below indicate . . . for all their official production measurements, OPEC uses an average of production estimates by six “secondary sources”, namely the International Energy Agency (IEA), the oil-pricing agencies Platts and Argus, the U.S. Energy Information Administration (EIA), the oil consultancy Cambridge Energy Research Associates (CERA) and the industry newsletter Petroleum Intelligence Weekly, as a means of impartially adjudicating whether their output quotas and production cuts are being met, to thereby avert any potential disputes that could arise if each member reported their own figures…
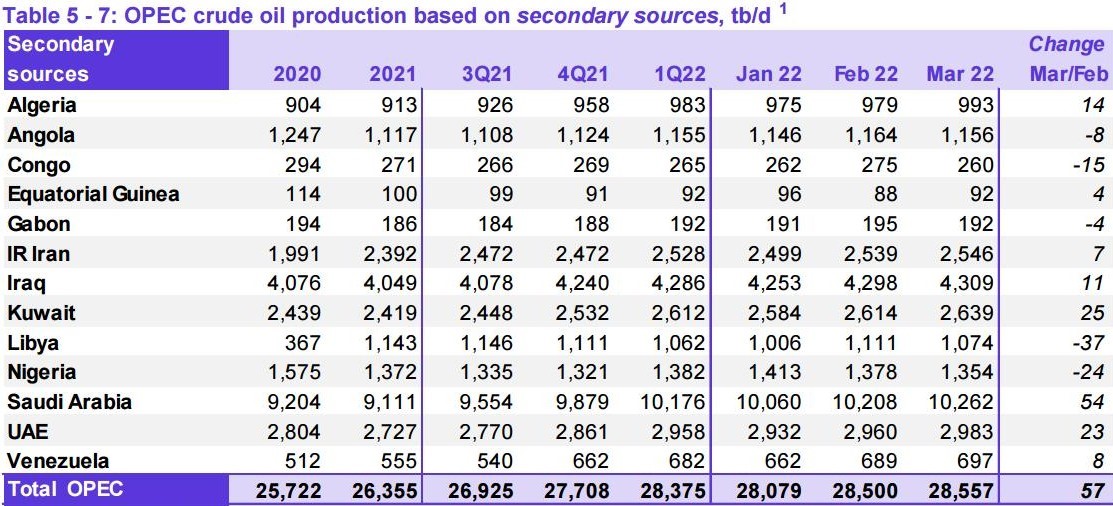
As we can see on the bottom line of the above table, OPEC’s oil output increased by 57,000 barrels per day to 28,557,000 barrels per day during March, up from their revised February production total of an average of 28,500,000 barrels per day . . . however, that February output figure was originally reported as 28,473,000 barrels per day, which therefore means that OPEC’s January production was revised 27,000 barrels per day higher with this report, and hence OPEC’s February production was, in effect, 84,000 barrels per day higher than the previously reported OPEC production figure (for your reference, here is the table of the official January OPEC output figures as reported a month ago, before this month’s revision)…
According to the agreement reached between OPEC and the other oil producers at their Ministerial Meeting on July 18th, 2021, the oil producers party to that agreement were to raise their output by a total of 400,000 barrels per day each month through December 2021, which was subsequently renewed to include further monthly 400,000 barrel per day production increases in January, February, March and April 2022, and which would indicate an increase of 254,000 barrels per day each month from the OPEC members listed above, with the rest supplied by other producers. including Russia . . . but as we can see from the above table, OPEC’s increase of 57,000 barrels per day fell far short of that . . . the production decreases in Nigeria, which has ongoing pipeline theft and leakage problems, and Libya, with their repeated bouts of civil strife, are obviously part of the reason for the March shortfall, but even Saudi Arabia fell 50,000 barrels per day short of what they were expected to produce, as we’ll see in the next table . . .

The adjacent table was originally included as a downloadable attachment to the press release following the 25th OPEC and non-OPEC Ministerial Meeting on February 2nd, 2022, which set OPEC’s and other aligned producers production quotas for March . . . since war torn Libya and US sanctioned producers Iran and Venezuela are exempt from the production cuts imposed by the joint agreement that governs the output of the other OPEC producers, they are not shown here, and OPEC’s quota is aggregated under the total listed for the ‘OPEC 10’, which you can see was to be at 25,061,000 barrels per day in March . . . therefore, the 24,240,000 barrels those 10 OPEC members actually produced in March were 821,000 barrels per day short of what they were expected to produce during the month, with Nigeria and Angola accounting for most of this month’s shortfall, while only Kuwait and the UAE were able to produce what was expected of them . . .
Recall that the original 2020 oil producer’s agreement was to jointly cut their oil production by 23%, or by 9.7 million barrels per day, from an October 2018 baseline for just two months early in the pandemic, during May and June of 2020, but that initial 9.7 million bpd production cut agreement was extended to include July 2020 at a meeting between OPEC and other producers on June 6th, 2020 . . . then, in a subsequent meeting in July of that year, OPEC and the other oil producers agreed to ease their deep supply cuts by 2 million barrels per day to 7.7 million barrels per day for August 2020 and subsequent months, which thus became the agreement that governed OPEC’s output for the rest of 2020 . . . the OPEC+ agreement for their January 2021 production, which was later extended to include February and March and then April’s output, was to further ease their supply cuts by 500,000 barrels per day to a cut of 7.2 million barrels per day from that original 2018 baseline . . . then, during a difficult meeting on April 1st of last year, OPEC and the other oil producers that are aligned with them agreed to incrementally adjust their oil production higher each month by a pre-set amount for each country over the following three months, thus extending their joint output cut agreement through July . . . production levels for August and the following months of last year were to be determined by a July 1st OPEC meeting, but that meeting was adjourned on July 2nd due to a dispute between the UAE and the Saudis over the 2018 reference production levels, and a subsequent attempt to restart that meeting on July 5th was called off . . . so it wasn’t until July 18th 2021 that a tentative compromise addressing August 2021’s output quotas was worked out, allowing oil producers in aggregate to increase their production by 400,000 barrels per day in August, and again by that amount in each of the following months, and also to boost reference production levels for the UAE, the Saudis, Iraq and Kuwait beginning in April 2022 . . . OPEC and other producers then agreed to increase their production in January 2022 by a further 400,000 barrels per day in a meeting concluded on the 2nd of December, 2021, and reaffirmed their intention to continue that policy with another 400,000 barrel per day increase in February at a meeting concluded January 4, 2022, and then agreed to stick to that 400,000 bpd oil output increase in March, despite pressure from the US to raise output more quickly, at a meeting on February 2nd….then, at a meeting on March 2nd, OPEC and its oil-producing allies, which included Russia, decided to hold their production increase at that level thru April in an OPEC+ meeting that only lasted 13 minutes, their shortest meeting ever . . . finally, on March 31, OPEC and aligned producers agreed to reaffirm the decisions of the prior Ministerial meetings and again limit their production increase to 400,000 barrels per day, because “the current [oil market] volatility is not caused by fundamentals, but by ongoing geopolitical developments”
Hence OPEC arrived at the production quotas for August 2021 through April of this year by repeatedly readjusting the original 23%, or 9.7 million barrel per day production cut from the October 2018 baseline that they first agreed to for May and June 2020, first to a 7.7 million barrel per day output reduction from the baseline for the remainder of 2020, then to a 7.2 million barrel per day production cut from the base-line for the first four months of this year, which was subsequently raised to an 8.2 million barrel per day oil output reduction after the Saudis unilaterally committed to cut their own production by a million barrels per day during the Covid surge of February, March, and then later during April of last year . . . under the agreement prior to the current one affecting this month, OPEC’s production cut in April 2021 was set at 4,564,000 barrels per day below the October 2018 baseline, which was lowered to a cut of 3,650,000 barrels per day from the baseline with the prior comprehensive agreement, which thus set the July production quota for the “OPEC 10” at 23,033,000 barrels per day, with war torn Libya and US sanctioned producers Iran and Venezuela exempt from the production cuts imposed by that agreement . . . for OPEC and the other producers to increase their output by 400,000 barrels per day from that July 2021 level, each producer would be allowed to initially increase their production by just over 1% per month since that time . . . for OPEC alone, a 254,000 barrel per day increase each month since, beginning with the July 2021 quota of 23,033,000 barrels per day, is how they arrived at the 25,061,000 barrels per day quota for OPEC for March that you see on the table above . . .
The next graphic from this month’s report that we’ll look at shows us both OPEC’s and worldwide oil production monthly on the same graph, over the period from April 2020 to March 2022, and it comes from page 46 (pdf page 56) of OPEC’s April Oil Market Report . . . on this graph, the cerulean blue bars represent OPEC’s monthly oil production in millions of barrels per day as shown on the left scale, while the purple graph represents global oil production in millions of barrels per day, with the metrics for global output shown on the right scale . . .

Including this month’s 57,000 barrel per day increase in OPEC’s production from their revised production of a month earlier, OPEC’s preliminary estimate is that total global liquids production increased by a rounded 370,000 barrels per day to average 99.66 million barrels per day in March, a reported increase which came after February’s total global output figure was apparently revised down by 210,000 barrels per day from the 99.50 million barrels per day of global oil output that was estimated for February a month ago, as non-OPEC oil production rose by a rounded 320,000 barrels per day in March after that downward revision, with 260,000 barrels per day of the increase coming from the US and Norway, due to the resolution of weather related outages and a shale oil production increase in March…
After that increase in March’s global output, the 99.66 million barrels of oil per day that were produced globally during the month were 6.45 million barrels per day, or 6.9% more than the revised 93.21 million barrels of oil per day that were being produced globally in March a year ago, which was the third month that OPEC and their allied producers had reduced their output cuts by 500,000 barrels per day from the 7.7 million barrels per day production cut that they applied to the last 5 months of 2020, but also the second month that the Saudis had unilaterally decreased their own production by a million barrels per day in response to the pandemic’s hit to demand (see the April 2021 OPEC report (online pdf) for the originally reported March 2021 details) . . . with this month’s modest increase in OPEC’s output, their March oil production of 28,557,000 barrels per day amounted to 28.7% of what was produced globally during the month, down from their revised 28.8% share of the global total in February . . . OPEC’s March 2021 production was reported at 25,042,000 barrels per day, which means that the 13 OPEC members who were part of OPEC last year produced 3,515,000 barrels per day, or 14.0% more barrels per day of oil this March than what they produced a year earlier, when they accounted for 26.9% of global output . . .
After the increases in OPEC’s and global oil output that we’ve seen in this report, the amount of oil being produced globally during the month was a bit more than the expected global demand, as this next table from the OPEC report will show us . . .
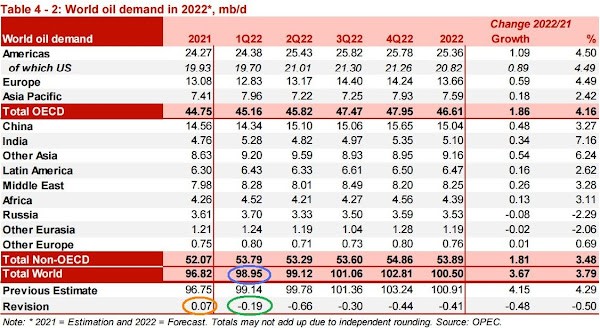
The table comes from page 26 of the April Oil Market Report (pdf page 36), and it shows regional and total oil demand estimates in millions of barrels per day for 2021 in the first column, and then OPEC’s estimate of oil demand by region and globally quarterly over 2022 over the rest of the table . . . on the “Total world” line in the second column, we’ve circled in blue the figure that’s relevant for March, which is their estimate of global oil demand during the first quarter of 2022 . . . OPEC is estimating that during the 1st quarter of this year, all oil consuming regions of the globe were using an average of 98.95 million barrels of oil per day, which is a downward revision of 19,000 barrels per day from their estimate for 1st quarter demand of a month ago (that revision is circled in green) . . . but as OPEC showed us in the oil supply section of this report and the summary supply graph above, OPEC and the rest of the world’s oil producers were producing 99.66 million barrels million barrels per day during March, which would imply that there was a surplus of around 710,000 barrels per day of global oil production in March, when compared to the demand estimated for the month . . .
Also note that in orange we’ve also circled an upward revision of 70,000 barrels per day to 2021’s demand, which also means that the supply shortfalls that we previously reported for last year would have to be revised . . . a separate table on page 25 of the March Oil Market Report (pdf page 35) indicates the revisions to 2021 demand included an an upward revision of 20,000 barrels per day to 4th quarter demand, an upward revision of 90,000 barrels per day to 3rd quarter demand, an upward revision of 80,000 barrels per day to 2nd quarter demand. and an upward revision of 140,000 barrels per day to 1st quarter demand . . . we’re not inclined to go back and recompute the shortages for each month of 2021, but we do have adequate totals for the year from our prior reports such that we can estimate an aggregate revision . . .
With the release of OPEC’s January Oil Market Report three months ago, we had complete and revised data for all of 2021, and found the world was short 527,910,000 barrels of oil during the year, which worked out to a shortage of 1,446,300 barrels of oil per day . . . OPEC’s February Oil Market Report then revised aggregate global demand for 2021 higher by 10,000 barrels per day, OPEC’s March Oil Market Report revised 2021 demand higher by 90,000 barrels per day, and now this month’s report has revised that demand higher by another 70,000 barrels per day . . . that means our original estimate of 2021’s oil shortage now needs to be revised a total 170,000 barrels per day higher, or to 1,616,300 barrels per day . . . that would therefore revise the total shortage of oil for last year up to 534,115,000 barrels . . . we’re still far from running out, however, because the quantities of oil being produced globally during the pandemic of 2020 still averaged over 1.1 trillion barrels, or over 3 million barrels per day more than anyone wanted . . .