Oil up and down, Natural Gas supplies down
RJS, Focus on Fracking, Oil jumps $15 to a 13½ year high, then tumbles $21; natural gas supplies now 16% below normal
Oil prices fell for just the second time since November this week, but not before jumping nearly $15 to a new 13½ year high before the market even opened for the week . . . after rising 26.3% to a 13½ year high of $115.68 a barrel last week after much of Russia’s oil was sanctioned or eschewed by the market, the contract price for US light sweet crude for April delivery shot up nearly $15 to $130.50 a barrel in off market trading on Sunday on the prospect for a full embargo of Russian oil and products by aligned Western countries, but pulled back from that peak in Asian trading after it became clear to oil traders Germany and other European countries were not on board with a full cut off of Russian oil to open the week at $121.33 in New York, and then eased further in volatile trading on Monday to settle with a modest $3.72 gain at $119.40 a barrel, after several EU countries pushed back against the proposed embargo on fears it would accelerate inflation and plunge their overexposed economies into recession . . . oil opened higher again on Tuesday with a Biden announcement that the US would ban Russian oil imports pending, and then spiked as much as $10 to $129.44 as fears of formal sanctions against Russian oil and fuel exports spurred concerns about supply availability, before falling more than halfway back to settle $4.30 higher on the session at $123.70 a barrel, after Putin signed an obscure decree restricting exports of “certain products and raw materials” until Dec. 31, without specifying which products and materials would be included or how severe the restrictions would be . . . oil opened higher and briefly punched to a 3% increase early Wednesday after the EIA reported across the board inventories drawdowns, but then tumbled nearly 15% to close $15.00 lower at $108.70 a barrel after the United Arab Emirates and Iraq stated they would be encouraging OPEC to consider higher production levels . . . however, oil prices rebounded almost 6% to nearly $115 a barrel early Thursday, as the fallout from Russia’s invasion of Ukraine continued to rattle the market. but later tumbled 8% to close $2.68 lower at $106.02 a barrel, after Russia pledged to fulfill contractual obligations and some traders told the media supply disruption concerns were overdone . . . oil prices pushed higher in early morning trading on Friday after the highest-level talks between Russia and Ukraine since the start of the war failed to yield progress, and then moved to new highs on the day after the US and its European partners paused negotiations on a nuclear deal with Iran, impeding sanctions relief for the Islamic Republic’s oil exports, while hostilities in Ukraine fanned concerns over further disruptions to global supply chains and deeper inflation in global economies, before finishing the session $3.31 higher at $109.33 a barrel as traders weighed ongoing worries about global energy supplies against a move by the U.S. to revoke Russia’s favor nation trade status, but still ended with a loss of 6.2% on the week..
With oil prices hitting another 13 1/2 year high, we’re going to include a price graph, but this time we’re going to narrow our focus so that you can see that the new high was actually set on Sunday, before markets opened for the week…
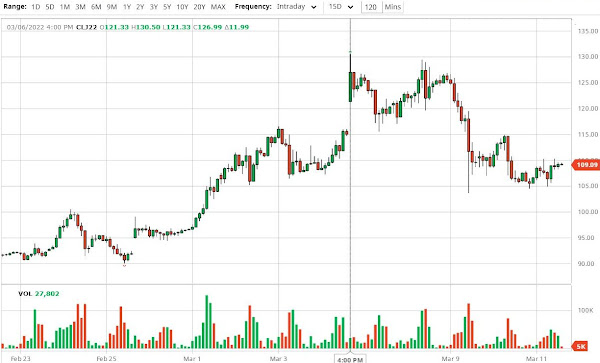
The above is a screenshot of the current interactive and continuously updated oil price chart from barchart.com, which i have reset to show front month oil prices in 2 hours increments over the most recent 15 day period, the same oil prices that were quoted by the media over that period . . . this interactive chart can also be reset to show prices of front month or individual monthly oil contracts over time periods ranging from 1 day to 30 years, as the menu bar on the top indicates, and also to show oil prices by the minute, hour, day, week or month for each . . . each bar in the graph above represents the range of oil prices over 120 minutes, with those two hour periods when prices rose indicated in green, with the starting price at the bottom of the green bars and the ending price at the top, and periods when prices fell indicated in red, with the starting price at the top of red bars and the ending price at the bottom, while the small sticks above or below each monthly bar represent the extent of the price change above or below the opening and closing price during the period in question . . . meanwhile, the bars across the bottom show trading volume for cited oil contract for the two hour period in question, again with rising price periods indicated by green bars and falling price periods indicated in red….
By setting my cursor over Sunday afternoon at 4 PM on that graph, I was able to bring up a readout of the prices during that 2 hour period in the upper left of the graph…there you can see that oil prices started at $121.33 a barrel at the beginning of that period, rose to as high as $130.50 a barrel during the period, and then finished at $126.99 a barrel at 6PM Sunday evening…while oil prices again approached $130 a barrel during the 8AM and 10AM periods on Tuesday, they never topped it, leaving Sunday afternoon’s price the highest point on the graph…we can further establish that as the highest since July 2008 by viewing the 20 year oil price graph that we posted last week…
Meanwhile, natural gas prices also finished lower for the first time in four weeks, as traders refocused on the domestic supply and demand situation and forecasts turned warmer . . . after rising 12.2% to $5.016 per mmBTU last week on record European gas prices and on a colder forecast for mid-March, the contract price of natural gas for April delivery opened higher on Monday but quickly slid more than 3% to close 18.3 cents lower at $4.833 per mmBTU, as revised forecasts indicated less cold weather and lower heating demand next week than they had previously indicated . . . with even milder forecasts and spring weather approaching, natural gas prices sunk 30.6 cents or more than 6% to $4.527 per mmBTU on Tuesday, and then slipped another tenth of a cent to $4.526 per mmBTU on Wednesday, as rising domestic demand offset the impact of tanking global gas prices . . . natural gas prices rebounded a bit on Thursday, rising 10.5 cents to $4.631 mmBTU, boosted by a triple-digit decline in inventories and by near-record LNG exports which were causing a larger draw from storage than had been expected . . . natural gas prices then increased another 9.4 cents to settle at $4.725 per mmBTU on Friday, as a rash of freezing air in the Rocky Mountains, Midcontinent and into Texas forced freeze-offs that cut into production, just as near-term heating demand escalated ahead of the weekend, but still settled 5.8% lower on the week…
The EIA’s natural gas storage report for the week ending March 4th indicated that the amount of working natural gas held in underground storage in the US fell by 124 billion cubic feet to 1,519 billion cubic feet by the end of the week, which left our gas supplies 281 billion cubic feet, or 15.6% below the 1,800 billion cubic feet that were in storage on March 4th of last year, and 290 billion cubic feet, or 16.0% below the five-year average of 1,809 billion cubic feet of natural gas that have been in storage as of the 4th of March over the most recent five years . . . the 124 billion cubic foot withdrawal from US natural gas working storage for the cited week was a bit more than the average forecast for a 120 billion cubic foot withdrawal expected by an S&P Global Platts survey of analysts, while it was more than double the 59 billion cubic feet that were pulled from natural gas storage during the corresponding week of 2021, and was also much more than the average withdrawal of 89 billion cubic feet of natural gas that have typically been pulled out natural gas storage during the same week over the past 5 years…
Oil (WTI) closed at $103.01 today, down another $6.32 from Friday, and it had briefly traded under $100 earlier….you should all be able to tell from the price graph above that oil was priced just over $90 two weeks ago, ran up a record $24.09 in one week to $115.68, then hit $130.50 last Sunday before tumbling back to below $100 earlier today…
In comments last week I pointed out that the oil companies have no control over the price of oil, that they have to take the price set by speculators. John Kemp, senior energy analyst at Reuters, keeps track of trading in oil by hedge funds each week.
Here’s what they were doing before the price run-up began:
Hedge funds anticipate oil price spike, possible recession: Kemp – (Reuters) – Oil traders are anticipating a sharp spike in prices that will likely bring on a business cycle slowdown after Russia’s invasion of Ukraine was met by severe sanctions that are disrupting the country’s petroleum exports. Hedge funds and other money managers purchased the equivalent of 16 million barrels in the six most important petroleum futures and options contracts in the week to March 1, according to exchange and regulatory data.
Portfolio managers remain strongly bullish towards petroleum, with a net long position of 731 million barrels, which lies in the 65th percentile for all weeks since 2013 https://tmsnrt.rs/3hH1BJv).
Bullish long positions outnumber bearish short ones by a ratio of almost 7:1, in the 84th percentile, but the overall position has not changed much since the middle of January. Last week’s position changes were driven primarily by the reduction of previous bearish short positions (-20 million barrels) rather than creation of new bullish long ones (-4 million barrels).
Their ”net long” position of 731 million barrels is interesting, because as i’ve previously reported, our commercial supplies of crude oil in storage fell to 411,562,000 barrels on March 4th . . . that means that hedge funds were holding 178% of all of the oil that was available…
So what happened next? As John Kemp documented today:
Hedge funds slash oil positions amid extreme volatility: Kemp — Investors slashed bullish bets on oil last week as prices surged to multi-year highs, the economic outlook deteriorated, and extreme volatility made derivative positions more expensive to maintain.
Hedge funds and other money managers sold the equivalent of 142 million barrels in the six most important petroleum-related futures and options contracts in the week to March 8. Last week’s sales were the 11th largest out of 469 weeks since March 2013, according to records published by ICE Futures Europe and the U.S. Commodity Futures Trading Commission. Portfolio managers sold Brent (-97 million barrels), European gas oil (-23 million), U.S. gasoline (-13 million) and U.S. diesel (-11 million) and were buyers only of NYMEX and ICE WTI (+2 million). The selling was dominated by closure of existing bullish long positions (-114 million barrels) rather than initiation of new bearish short ones (+28 million), consistent with a risk-reducing strategy. Funds ended up with a net position in the six contracts of just 588 million barrels (45th percentile for all weeks since 2013) down from a recent peak of 761 million barrels (70th percentile) on Jan. 18.
Bullish long positions outnumbered bearish short ones by a ratio of 4.76:1 (61st percentile) down from 6.24 (80th percentile) in mid-January (https://tmsnrt.rs/3tXSCsU). In recent weeks, the record backwardation in futures prices, accelerating rise in spot prices, and increasing day-to-day volatility have been signs of a market under extreme stress and likely to reverse course. Soaring oil prices have been part of a broader increase in the price of raw materials, manufactured items and freight charges which has raised the probability of a recession within the next 12 months. Reflecting the deteriorating economic outlook and volatility costs, distillate positions were cut to 85 million barrels (67th percentile) last week down from a recent peak of 144 million barrels (85th percentile) five weeks earlier.
Obviously, the hedge funds have been on the winning side of both the price runup and its recent drop . . . but it’s also important to recall that futures market trading is a zero sum game, and oil companies trying to set their own positions in the middle of all that trading were most likely losers…
April WTI is now trading at $94.30…so it has now risen from $91.30 to $130.50 back to $94.30 in a little over 2 weeks….i have know way of knowing, but my best guess would be that the hedge funds that drove the price up are now short, forcing those who are long in this heavily margined market to sell, driving prices even lower, and hence increasing the profits of the shorts who initiated the recent downward price action…..this would be analogous to, but the opposite of, a short squeeze…