Pessimistic and optimistic scenarios for the winter wave
Coronavirus dashboard for November 26: pessimistic and optimistic scenarios for the winter wave, New Deal democrat
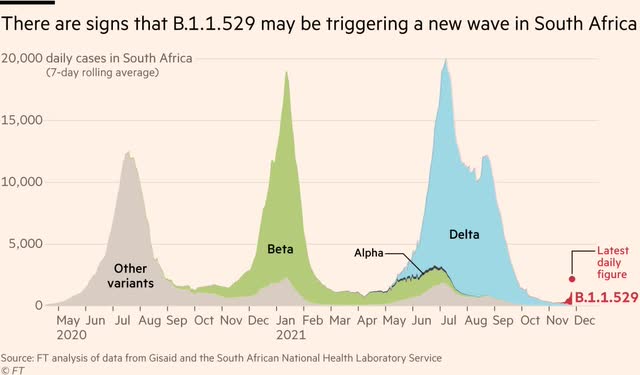
I hope all of you had a Happy Thanksgiving. Since I haven’t posted one in a bit, here is an update on the pandemic.As an initial matter, in the last day or two, there has been a mini-panic about a new strain out of South Africa called B.1.1.529 which may or may not get the designation Nu.
While this *may* be a concern, I wouldn’t worry just yet. Here’s a link to an excellent thread from Carl Bergstrom, a bio-statistician who is one of my go-to expert reads. He writes that “*If* the turn-around is due to increased transmissibility, instead of other e.g. behavior factors, it’s going to a rough winter,” but that while “the fraction of B.1.1.529 is increasing faster[, ] I think that is that is largely due to different denominators.”
Bottom line: worth watching, but the rate of increase is based on a *very* low number of cases – perhaps less than 1,000 cases so far, as shown in the below graph also posted by Bergstrom:
The question of the season is how much of a winter wave the US will have. A number of writers have posited that the US is going to have a very bad outbreak just like the EU has had in the last month or so.
That’s certainly possible. If the US *were* to have a winter wave comparable to that of the EU, that would be at least a 5-fold increase from our recent low of 80,000 cases per day to over 400,000 per day.
But I’m not so sure, mainly because unlike Europe, the US has had a recent very bad Delta wave that Europe mainly escaped. Since the UK did not escape Delta this summer (and has all but eliminated all its restrictions) it’s worthwhile to compare the two jurisdictions:
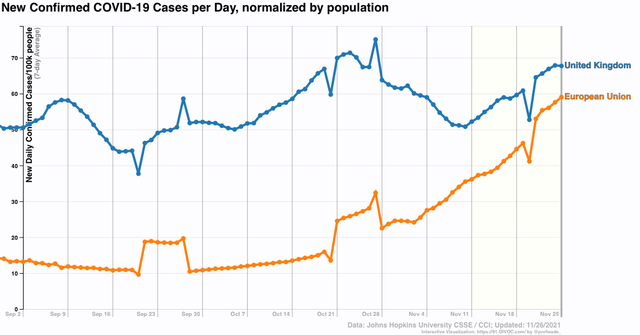
Cases in the UK have risen from about 50 to 68 per 100,000 in the past 45 days or so, while cases in the EU have risen from 10 to 60 per 100,000. While it would be wrong to simply project these trends forward, at least *so far* we can say that the UK has not had a wave anything like the EU (nor, for that matter, has Canada, with 75% of its population fully vaccinated, where cases have only risen from 5 to 7 cases per 100,000; or Israel, where cases in the past two months have dropped from over 100 to only 4 per 100,000 with 65% of its population fully vaccinated but a very aggressive booster shot campaign.
A look at the US by Census region since the beginning of the pandemic is very helpful in tracking climate effects as they affect patterns of infections because it appears that a pattern has emerged:
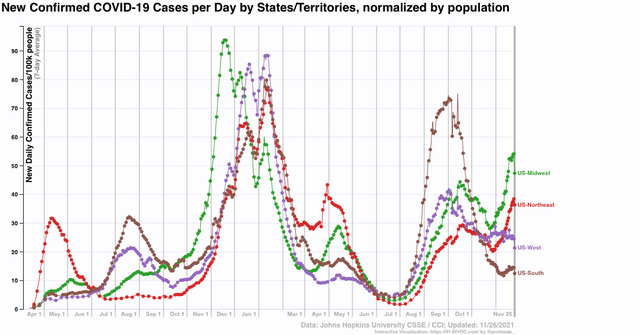
Leaving aside the initial NYC-centered outbreak, where testing was very poor, we see that in both 2020 and 2021 the summer outbreaks started and were most intense in the South, then spread to the West, then the Northeast and finally the Midwest; and that the summer outbreaks were least intense in those last two regions.
By contrast, in both autumn going into winter 2020 and 2021, the outbreaks first started in the Midwest, then the Northeast, before spreading to the West and the South. Again, in the last two Census regions, in 2020 the outbreaks were the least intense – and the same is true this year *so far.*
Also, focusing on autumn 2020, the region which peaked first was the Midwest, right around Thanksgiving week. It is noteworthy that the Midwest outbreak last year was apparently seeded during the August motorcycle rally in South Dakota, and spread out from there, with the Dakotas being particularly hard hit. This year there was another rally, but as the below graph of the two Dakotas shows, infections hit a peak in South Dakota in early September and have declined since:
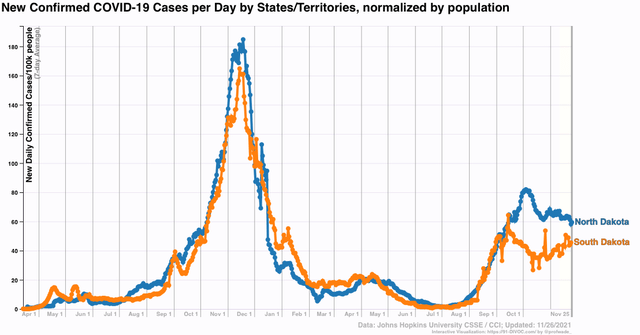
This is certainly evidence that prior infections – and both Dakotas have had *confirmed* infections of over 18% and 20% and probably double or more that in reality – appear to have a dampening effect on subsequent ones, even of Delta.
So, will the same pattern continue this autumn and winter, with the Midwest peaking now and other regions peaking two weeks after Christmas gatherings? A close-up of the 4 Census regions through Thanksgiving Day (so please ignore the last daily data entry, because it has everything to do with most States not bothering to report on the holiday) appears to suggest that this may be the case:
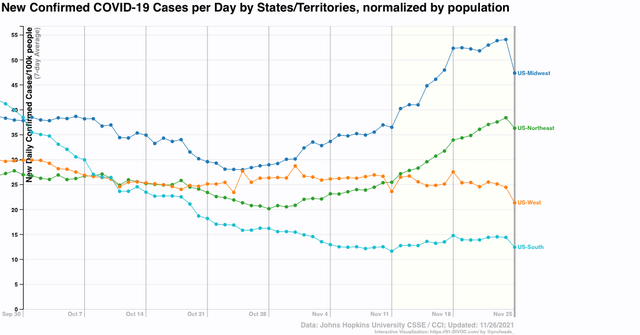
Most notably, there has been no increase in the Midwest since one week ago. There has only been a slight increase in the South in the past 45 days, and none in the West. This is *very* different from last year’s huge increases in all regions during November.
A look at the change in the one-week average in cases nationwide for the past 13 months shows that the 7 day average in cases was increased by almost 2 per 100,000 last November. By contrast, this year cases have increased on average only 0.5 cases per 100,000 per day:
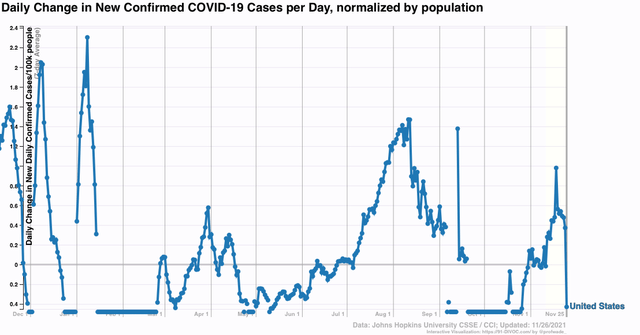
Last winter cases only increased roughly another 25% between Thanksgiving and the early January peak. If that pattern were to repeat this year, this would take us to a peak of about 45 per 100,000, or about 120,000 cases per day – only half of the 250,000 per day at the peak last winter. That’s the optimistic scenario.
Since a 120,000 winter peak is, needless to say, much more preferable than a 500,000 peak, let’s hope that the US’s summer Delta wave does blunt infections during the winter, and the optimistic scenario is the one that pans out.
New Virus Variant Stokes Concern but Vaccines Still Likely to Work
… scientists advise against overreaction
Omicron variant may already be in the US, Anthony Fauci says
Dr Anthony Fauci, the director of the National Institute of Allergy and Infectious Diseases, said on Saturday that while there is no indication the mutated virus has made its way over from South Africa, where it was initially detected earlier this week, citizens should take special care and avoid letting their guards down.
When asked whether he believed omicron has already arrived in the United States, Fauci said he “would not be surprised” if it has. …
“Variants” leap from the infectious disease lexicon to the general public as a result of the coronavirus
This presumably also means that ‘a new variant’ can appear spontaneously in different places, not necessarily carried by infected people.
Omicron variant threatens to unleash new global surge of COVID-19 pandemic
Scientists have detected a new variant of COVID-19, the Omicron (B.1.1.529) variant, which the World Health Organization (WHO) stated on Friday was officially recognized as “variant of concern” (VOC). The variant appears to have originated in southern Africa but has already been detected in several other countries. Initial indications are that an unusual constellation of mutations make the variant far more infectious than the Delta variant and potentially vaccine-resistant.
In its statement Friday, the WHO said that “preliminary evidence suggests an increased risk of reinfection with this variant, as compared to other VOCs,” including the Delta variant. “The number of cases of this variant appears to be increasing in almost all provinces in South Africa.”
The seven-day moving average of new cases in South Africa has risen fourfold from 265 to over 1,043 new COVID-19 cases per day in two weeks. Yesterday, the country reported 2,465 new infections. Seventy-five percent of all currently sequenced coronavirus cases are attributed to the latest variant, soon expected to reach 100 percent. New infections are exploding in highly urbanized Gauteng, a small northeastern province in South Africa, accounting for less than 2 percent of the country’s land area but home to a quarter of its population.
The new variant possesses over 50 mutations, with 32 on the virus’ spike protein, which it uses to bind to human respiratory cells. Dr. de Oliveira explained that many of these mutations are linked to increasing antibody resistance, which raises concerns that vaccines and therapeutics will be less effective in combating the new variant.
Expressing the gravity of the threat to the entire world population, the European Centers for Disease Control and Prevention issued a statement, warning, “given its immune escape potential and potentially increased transmissibility advantage compared to Delta, we assess the probability of further introduction and community spread in [Europe] as HIGH.” It added, “In a situation where the Delta variant is resurgent in [Europe], the impact of the introduction and possible further spread of Omicron could be VERY HIGH.”
According to Dr. Yaneer Bar-Yam, a complex system physicist who has been studying pandemics for nearly two decades, current rough estimates indicate that the Omicron variant is six times more transmissible than the original variant and twice as transmissible as the Delta variant. Bar-Yam also estimates that the mortality rate for Omicron is eight times higher than the original variant.
The prospect of a return to normal life has been stolen from us again, again so close to the finish line, by yet another vaccine-evading variant evolved in a third-world hellhole.
The people in southern Africa made decisions that lead to the prolongation of this catastrophe. Their choices made this. They have done this to us. They have taken our lives away from us again.
Every single city in southern Africa should be nuked.
but if you nuke em, nobody, the next time a country has an outbreak of a dangerous disease, they won’t tell anyone, and it will spread all over the planet before anyone knows what hit them. is that what you want?
Does Omicron feel like 2020? Here’s why it shouldn’t
… there is concern that the Omicron variant, which contains more than 30 mutations in the spike protein, could escape the immune protection offered by the current vaccines, as well as prior infection. …
All three US vaccine manufacturers — Johnson & Johnson, Pfizer-BioNTech, and Moderna — said that they will test how well their vaccines protect against the variant, but it could be a few weeks before they have that data in hand.
In the meantime, some drugmakers are accelerating the development of Omicron-specific vaccine candidates. It’s unclear whether tweaked vaccines are needed, but both Pfizer and Moderna have said they could make another version by early next year. Johnson & Johnson said it is also pursuing a potential vaccine targeting Omicron.
That’s a much swifter timeline than the effort to get the first COVID-19 vaccines authorized last year. The US Food and Drug Administration has indicated that it will not require booster doses to go through large clinical trials, in an effort to speed up their development and ability to target emerging variants. …
J&J joins Pfizer and Moderna in vowing to target Omicron variant